Basic Charts
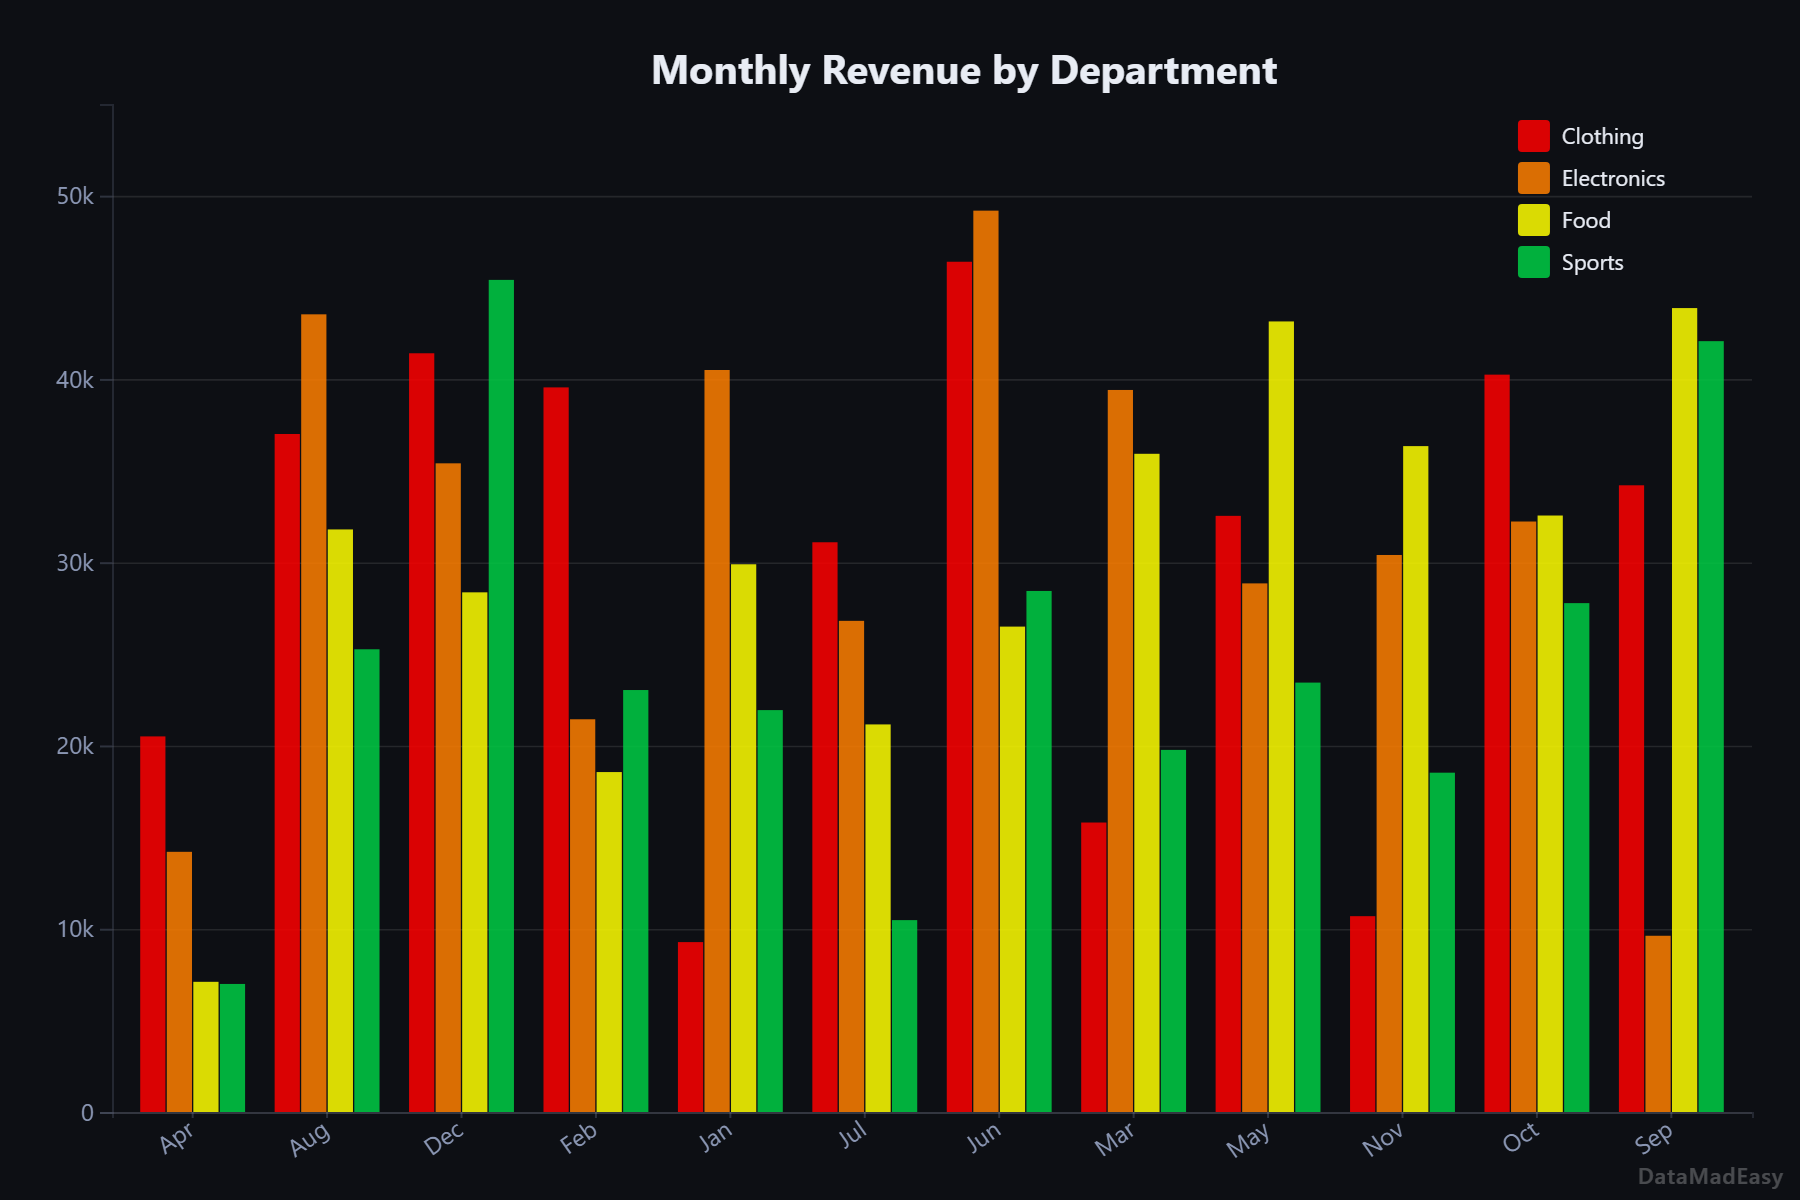
Bar Chart
Compare values across categories with vertical bars. Grouped, stacked, or 100%.
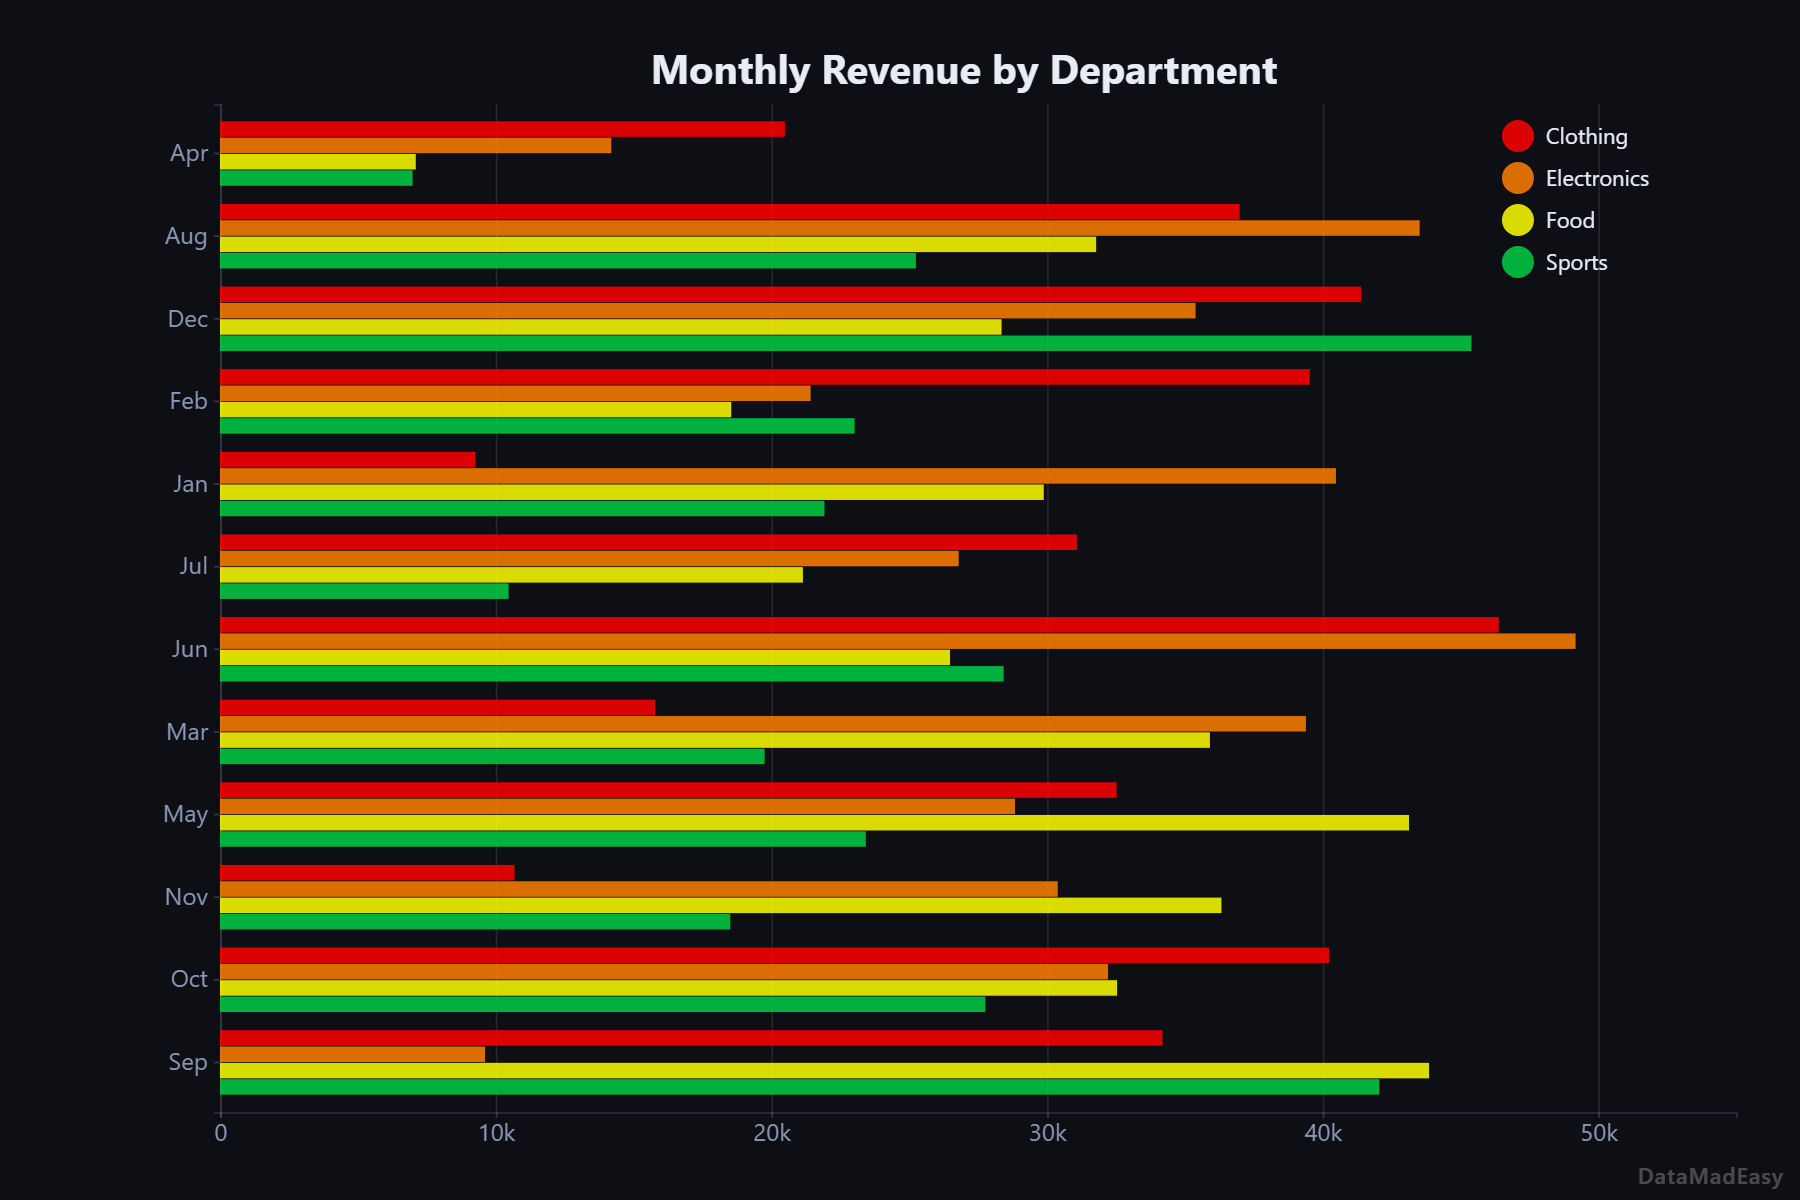
Horizontal Bar
Same as bar chart, rotated. Great for long category labels or ranking lists.
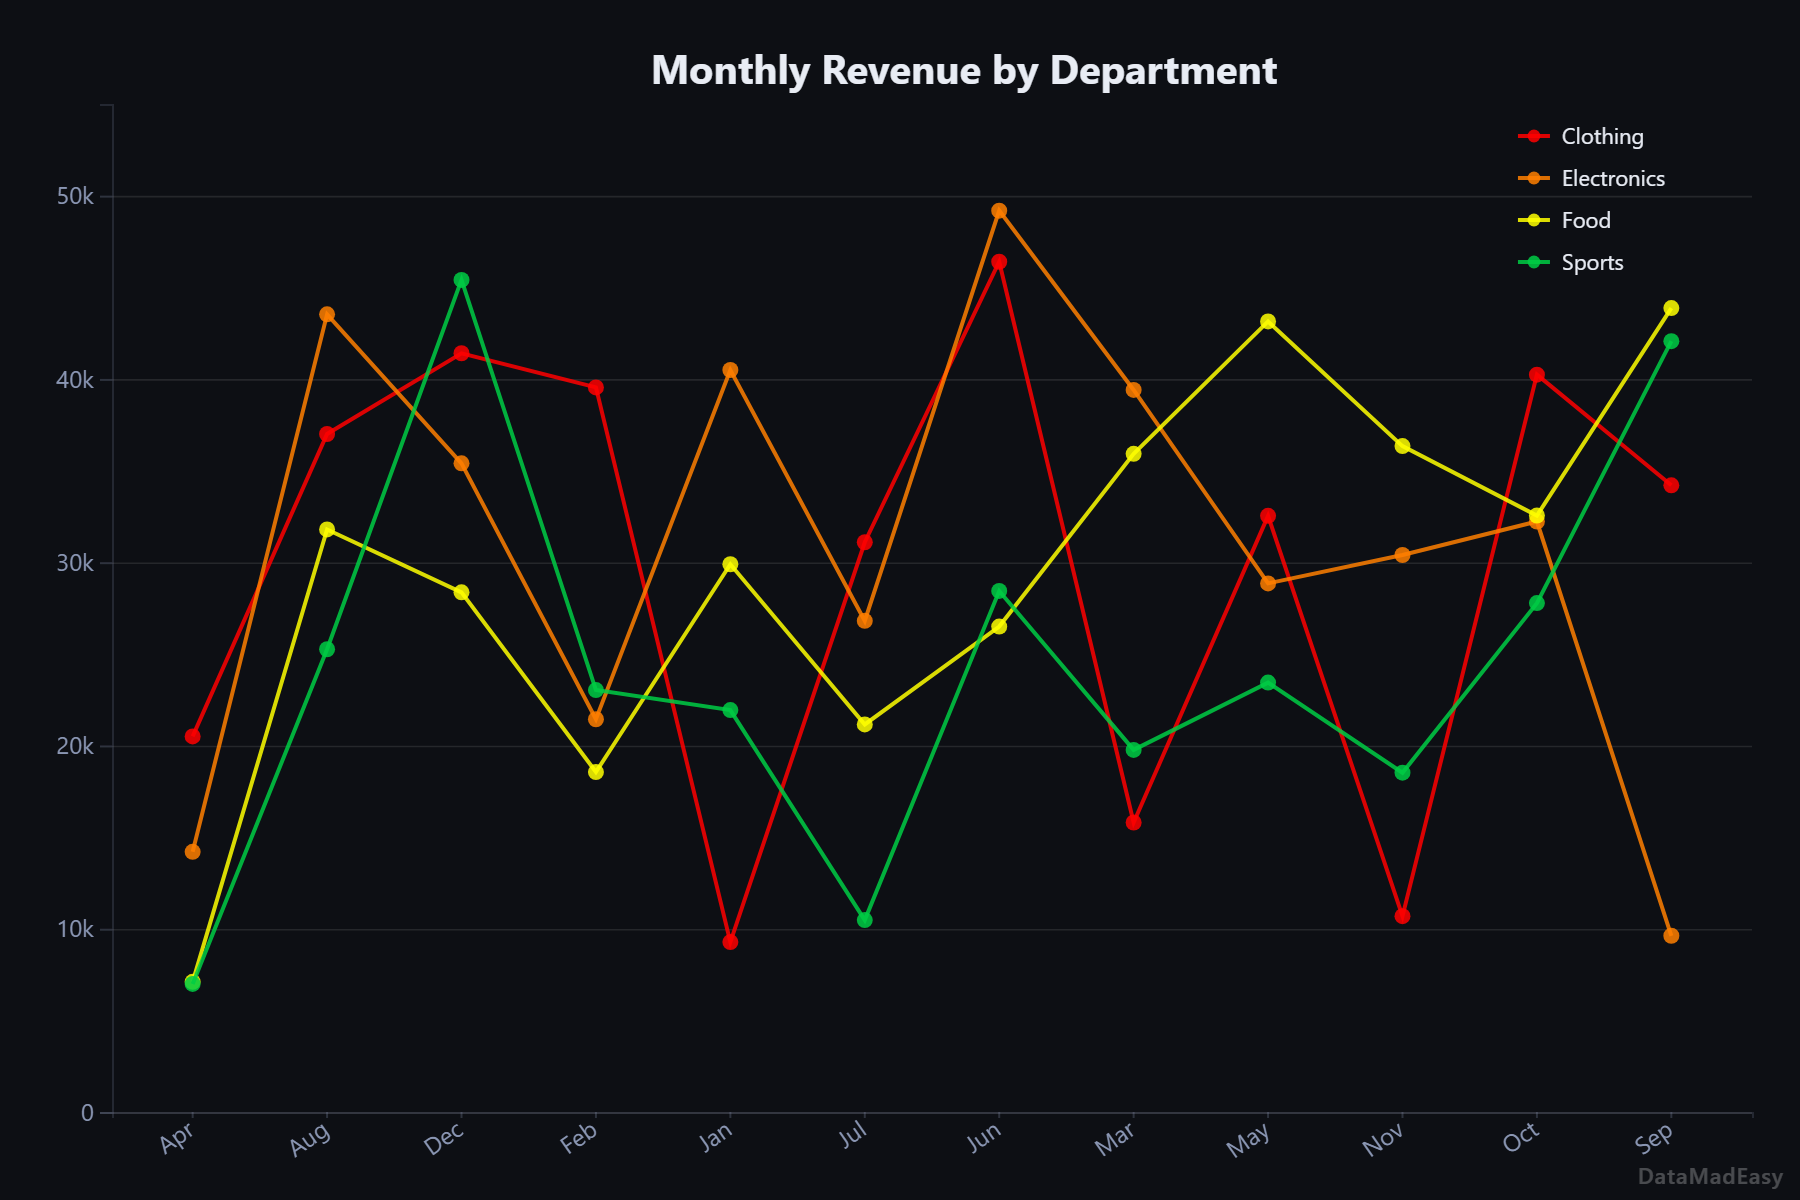
Line Chart
Track trends and changes over time. Supports multiple series, smooth curves, and stepped lines.
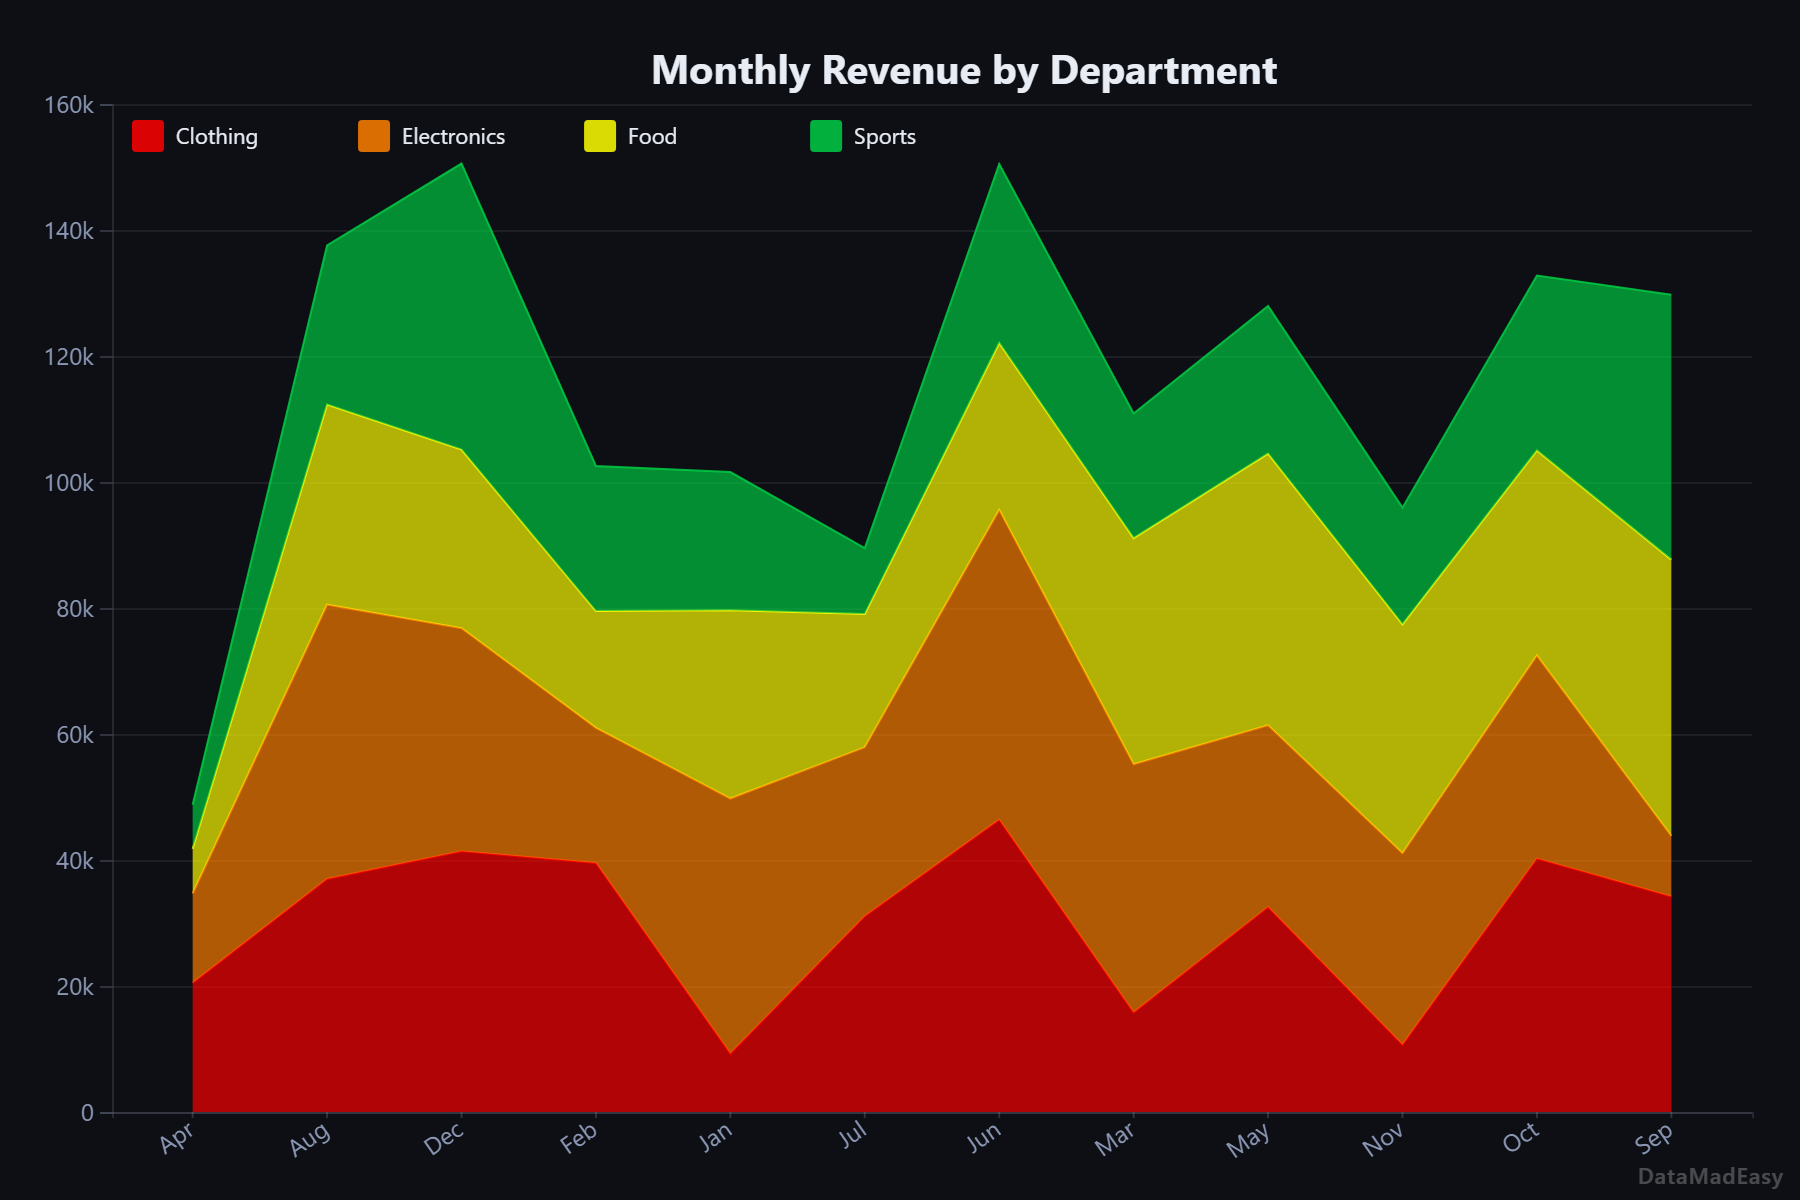
Area Chart
Filled line chart for showing volume and cumulative values. Stacked and 100% modes included.
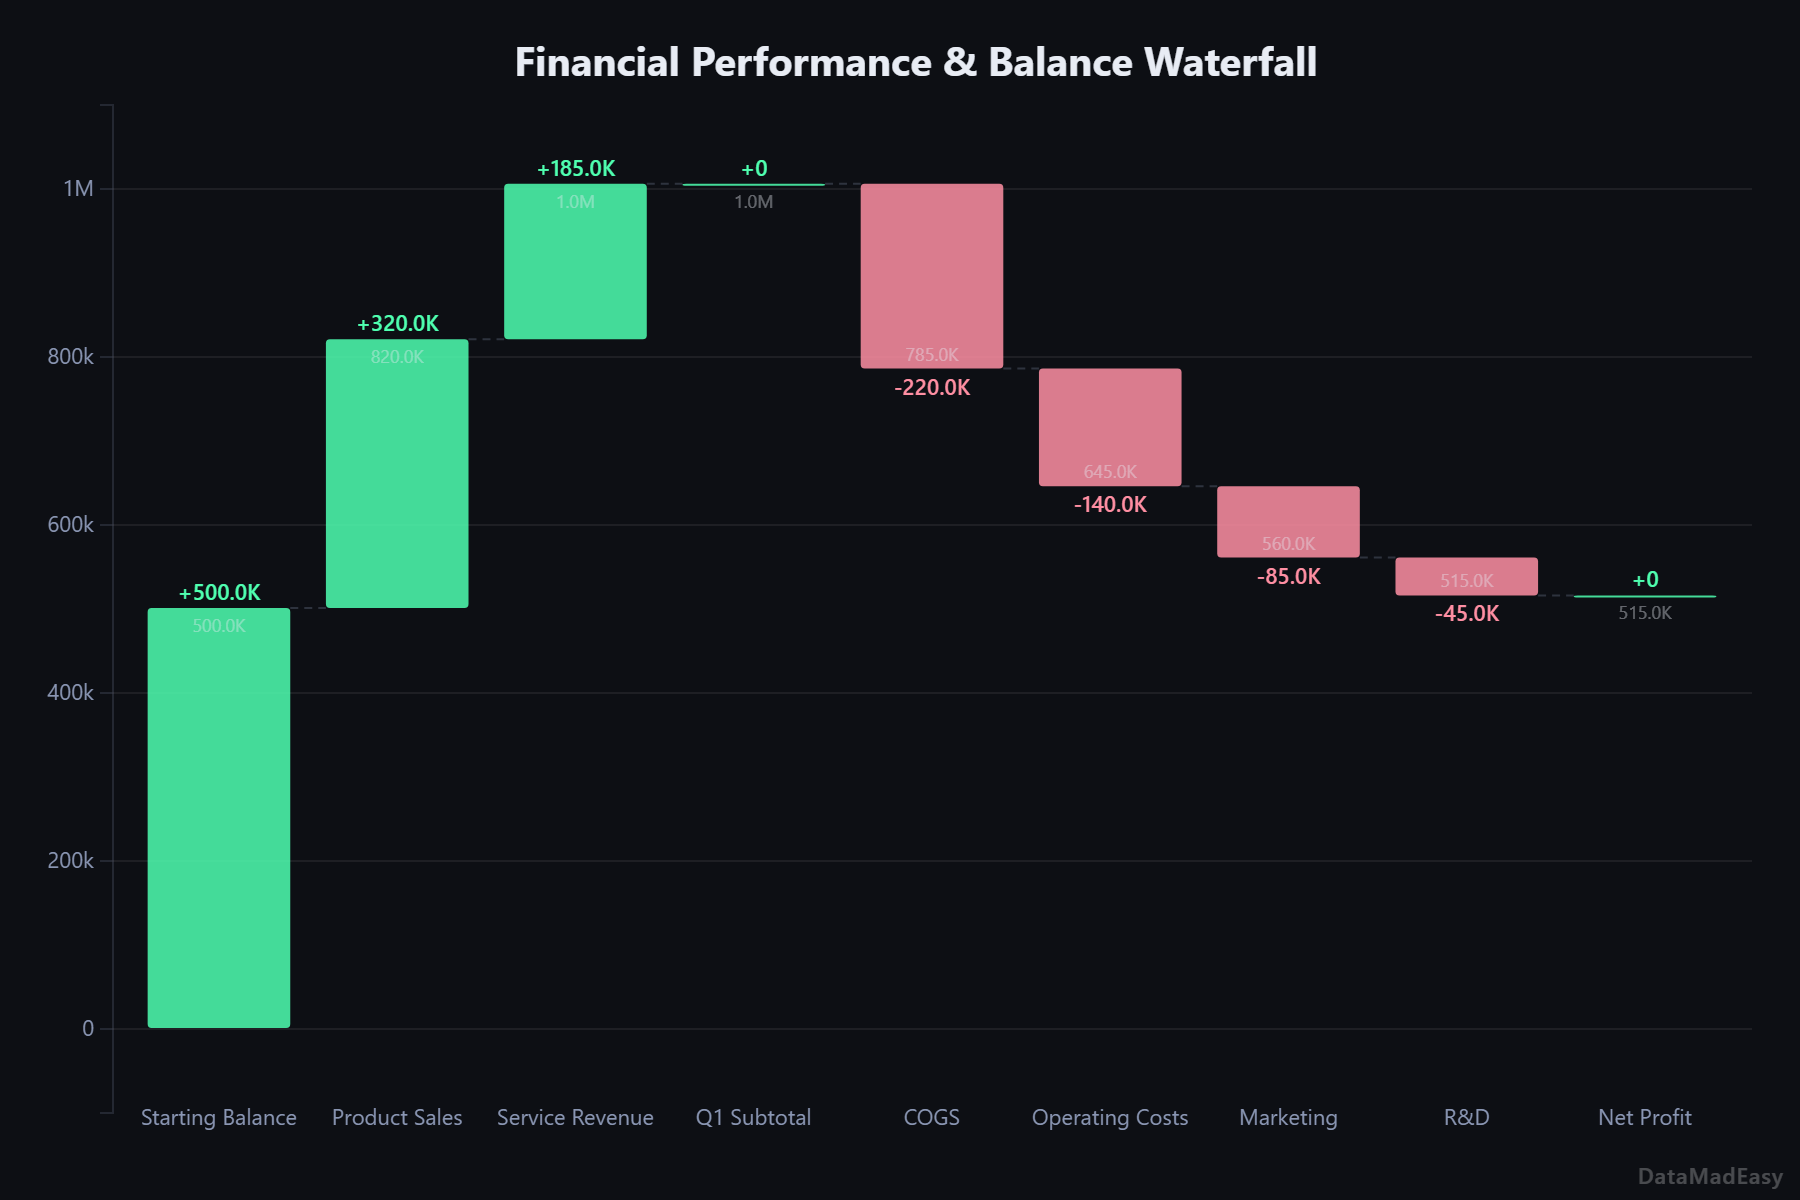
Waterfall Chart
Show how an initial value rises and falls through a series of changes. Perfect for financial statements.
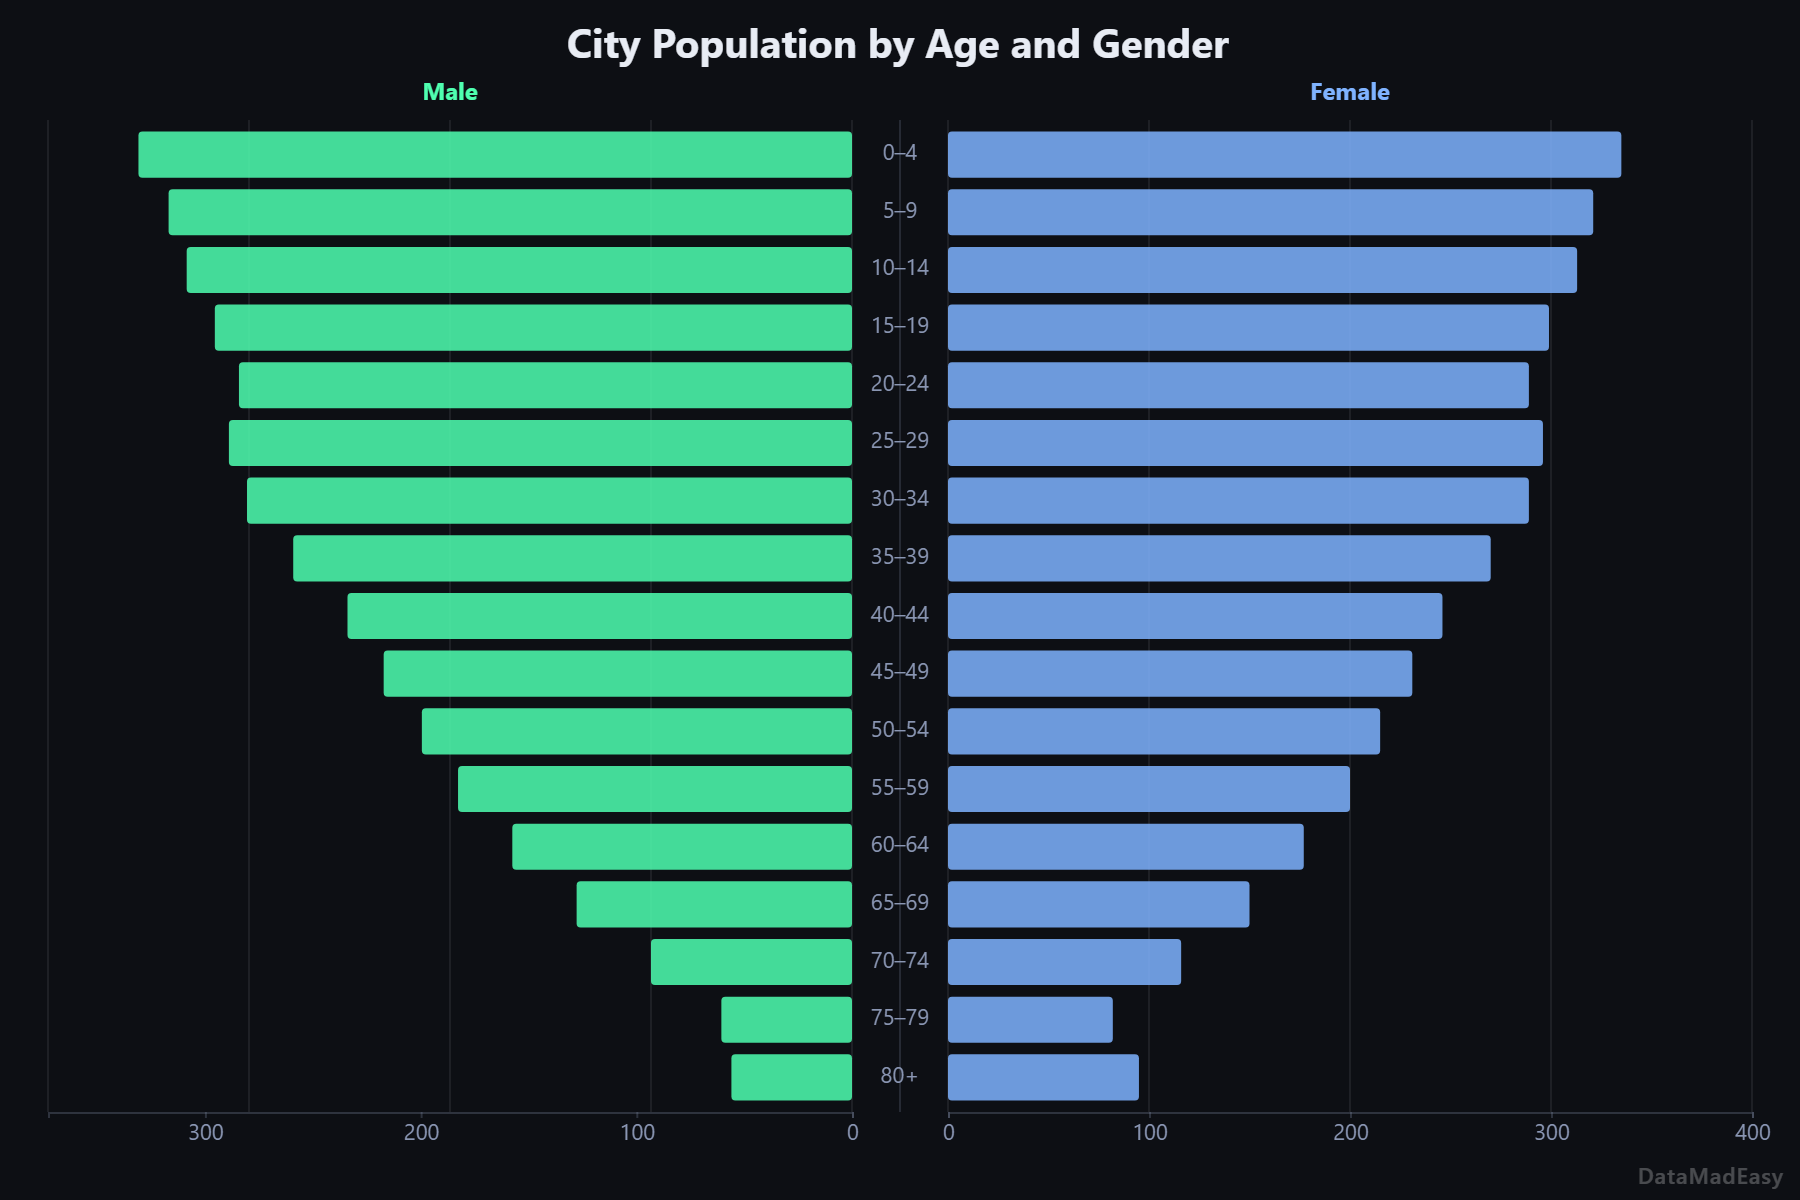
Pyramid Chart
Mirror two groups side by side. Classic for population pyramids — age vs male/female.
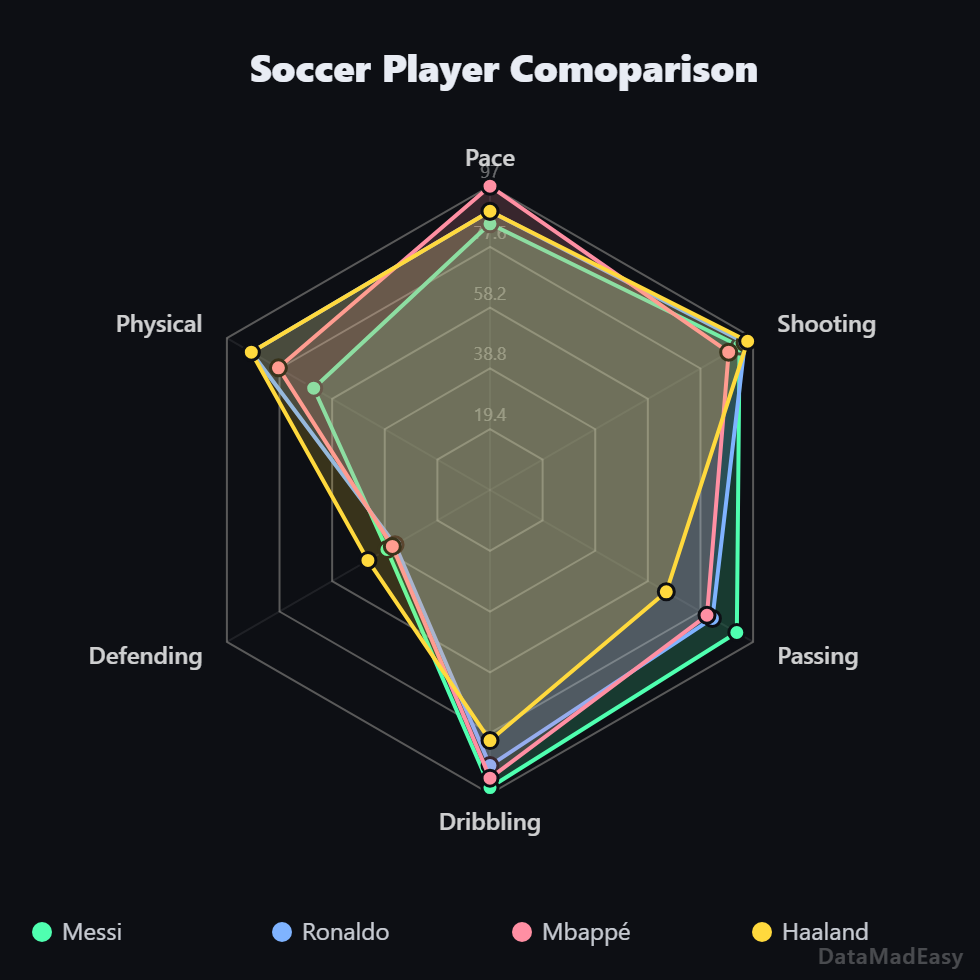
Radar Chart
Compare multiple attributes at once across a radial axis. Great for player stats or product comparisons.
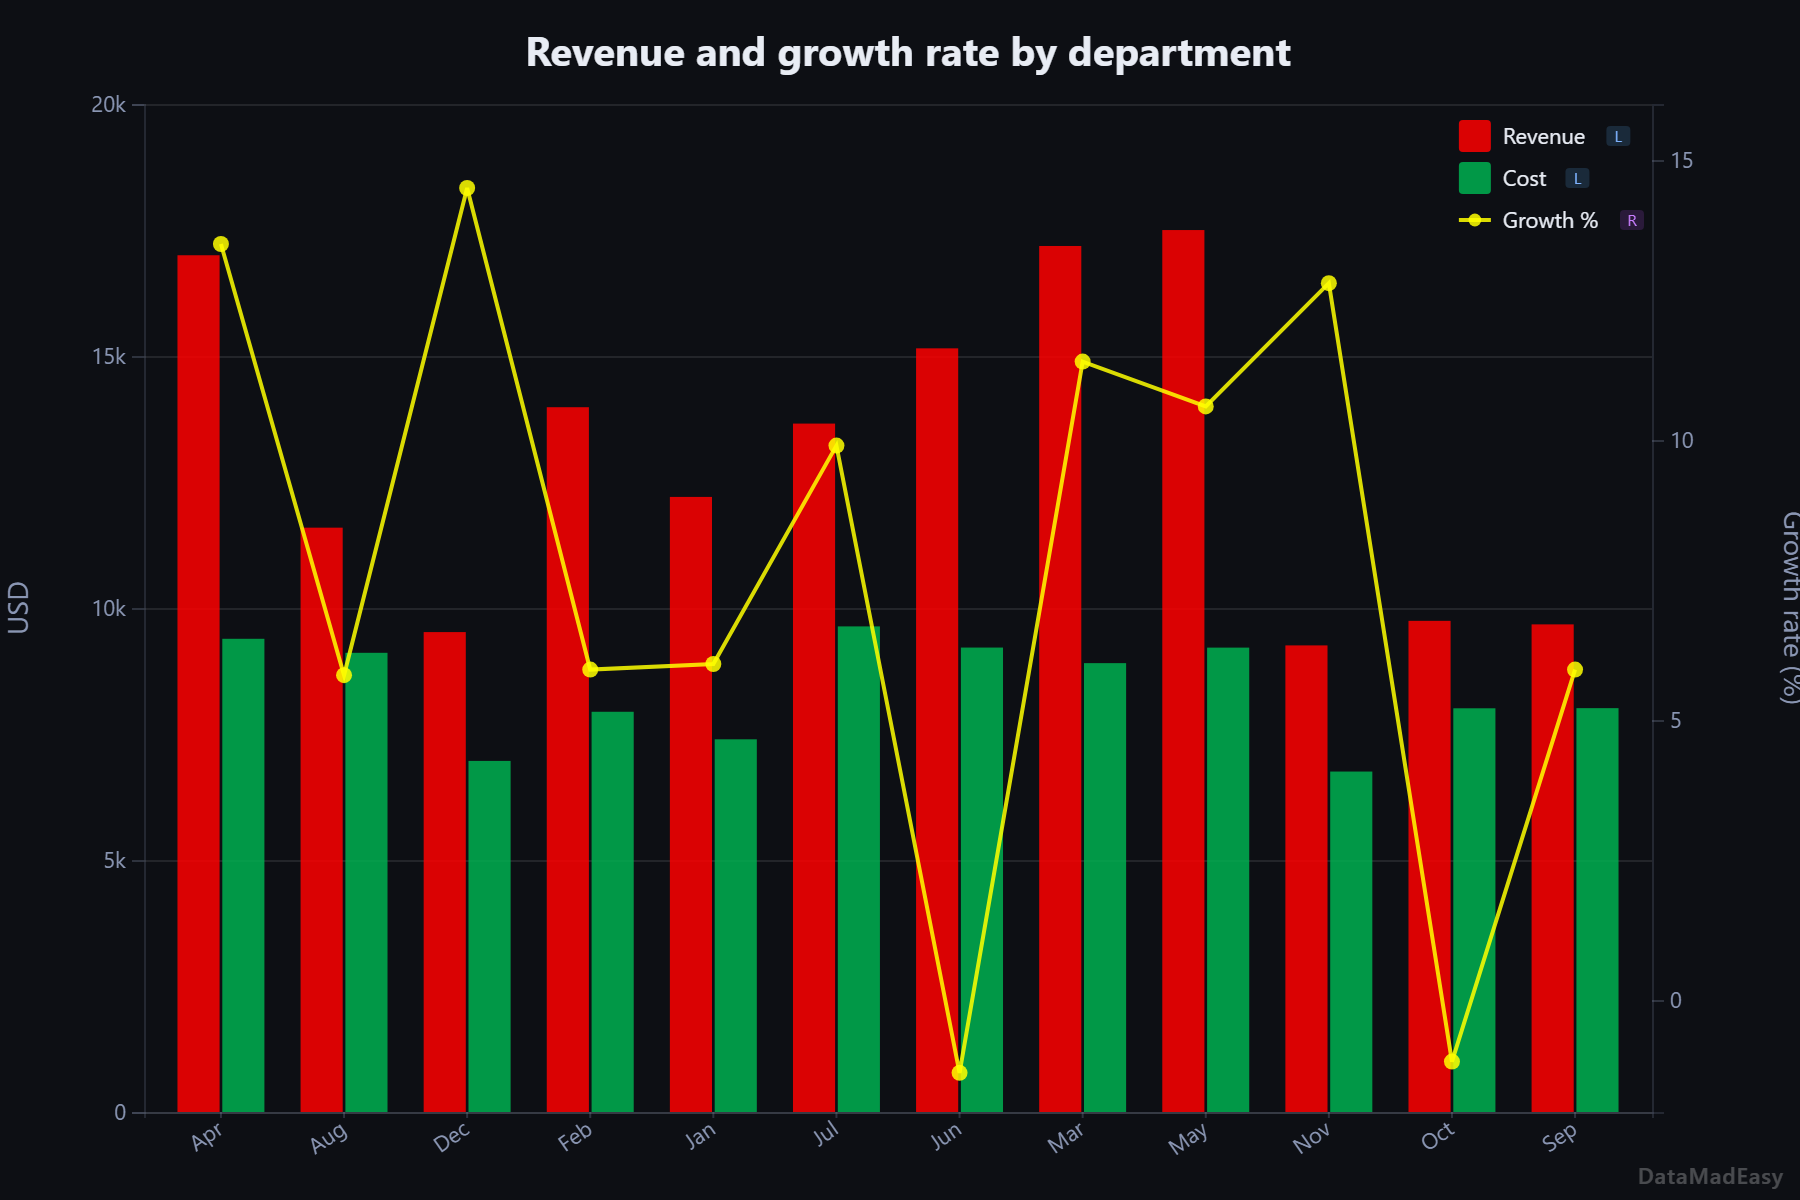
Combined Chart
Mix Bar, Line, and Dot series in one chart. Dual Y-axis support for different units.
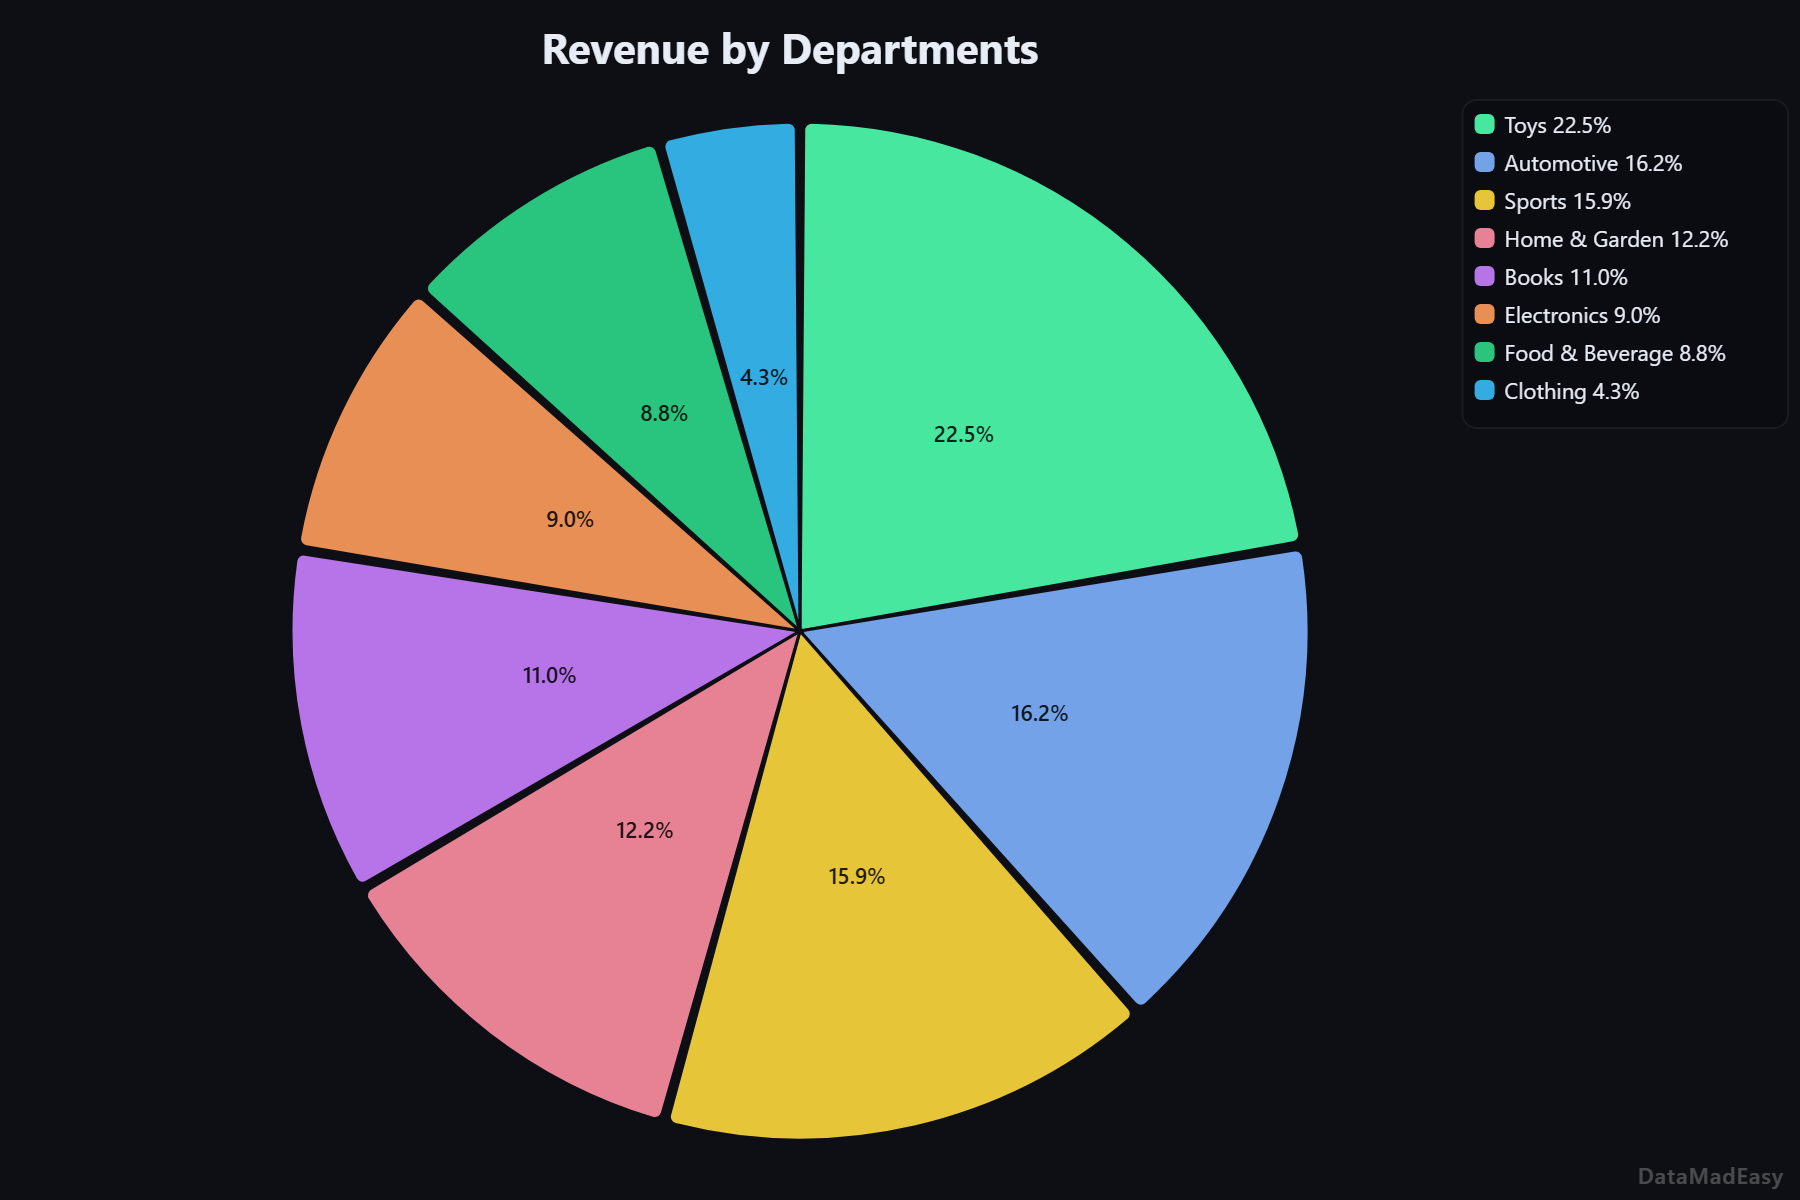
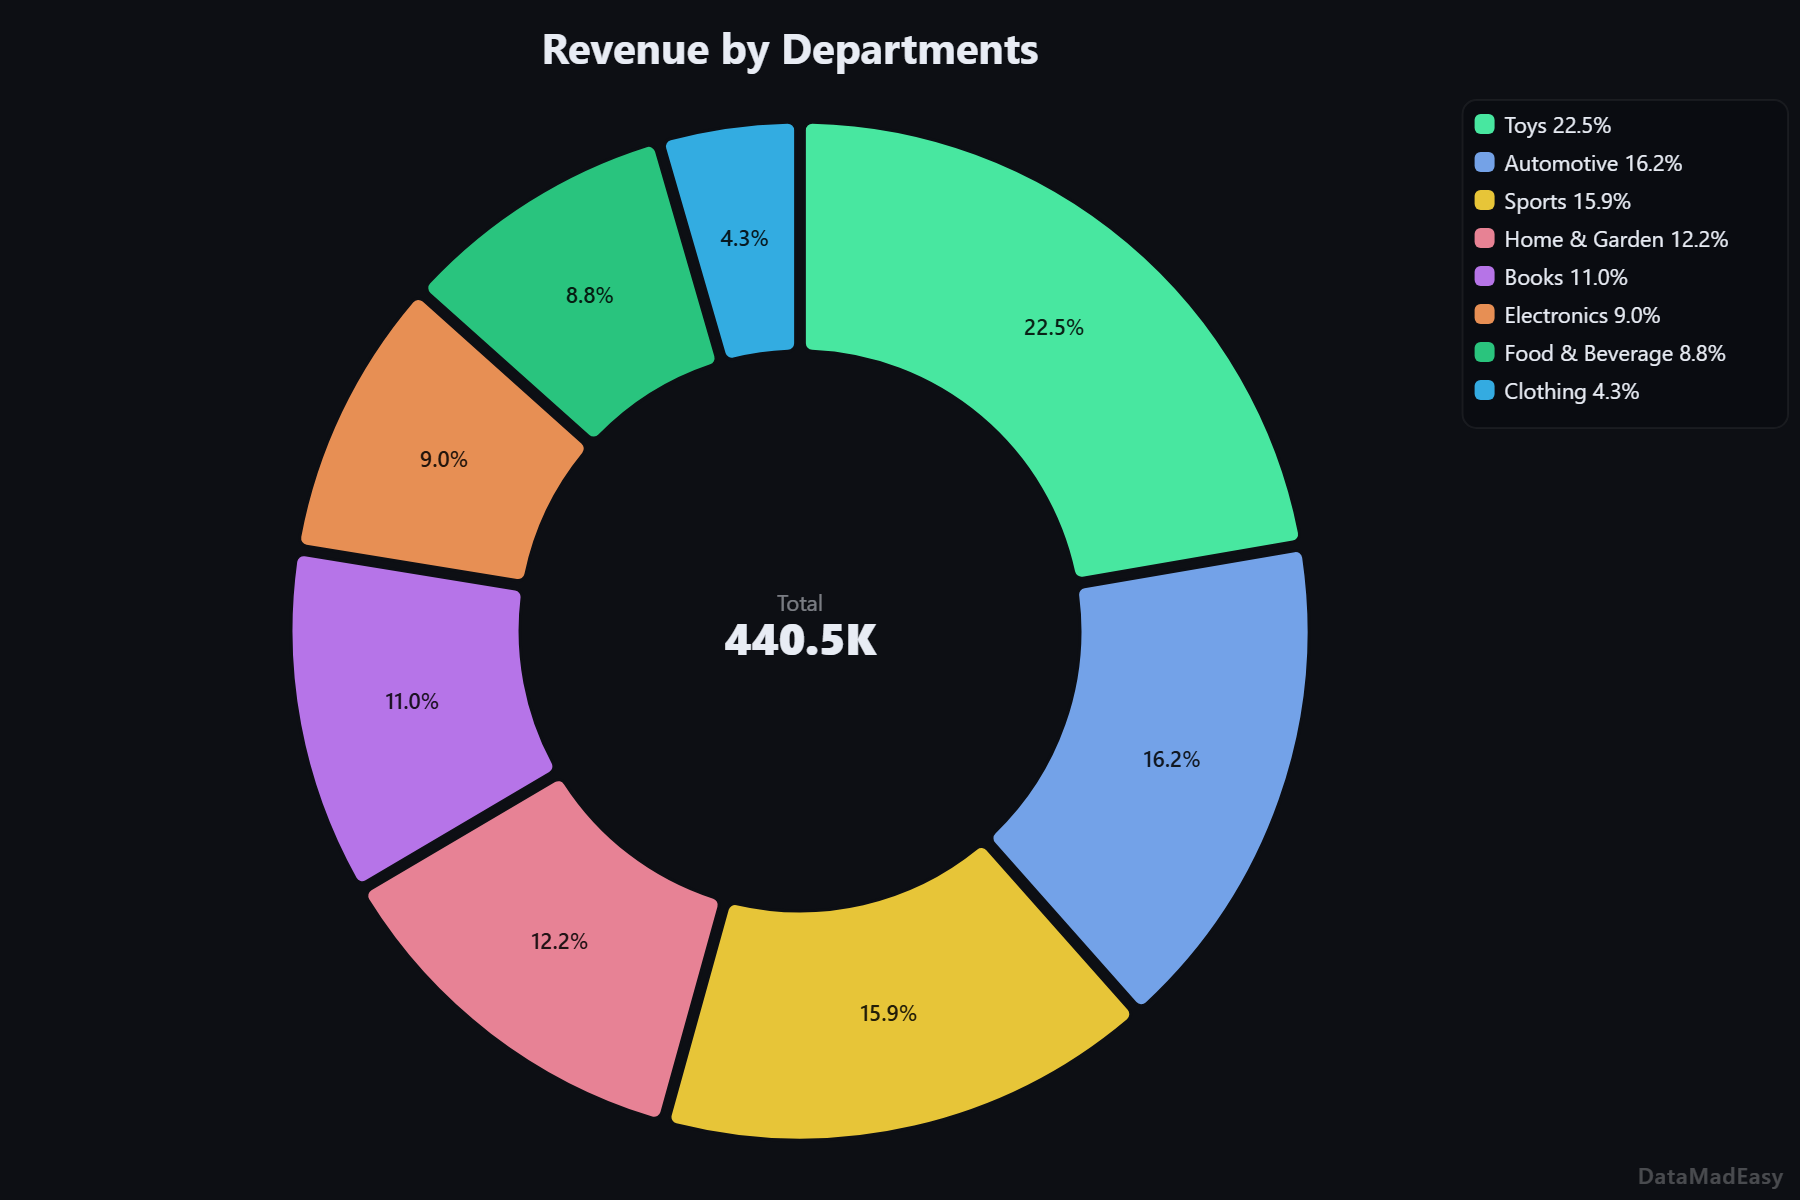
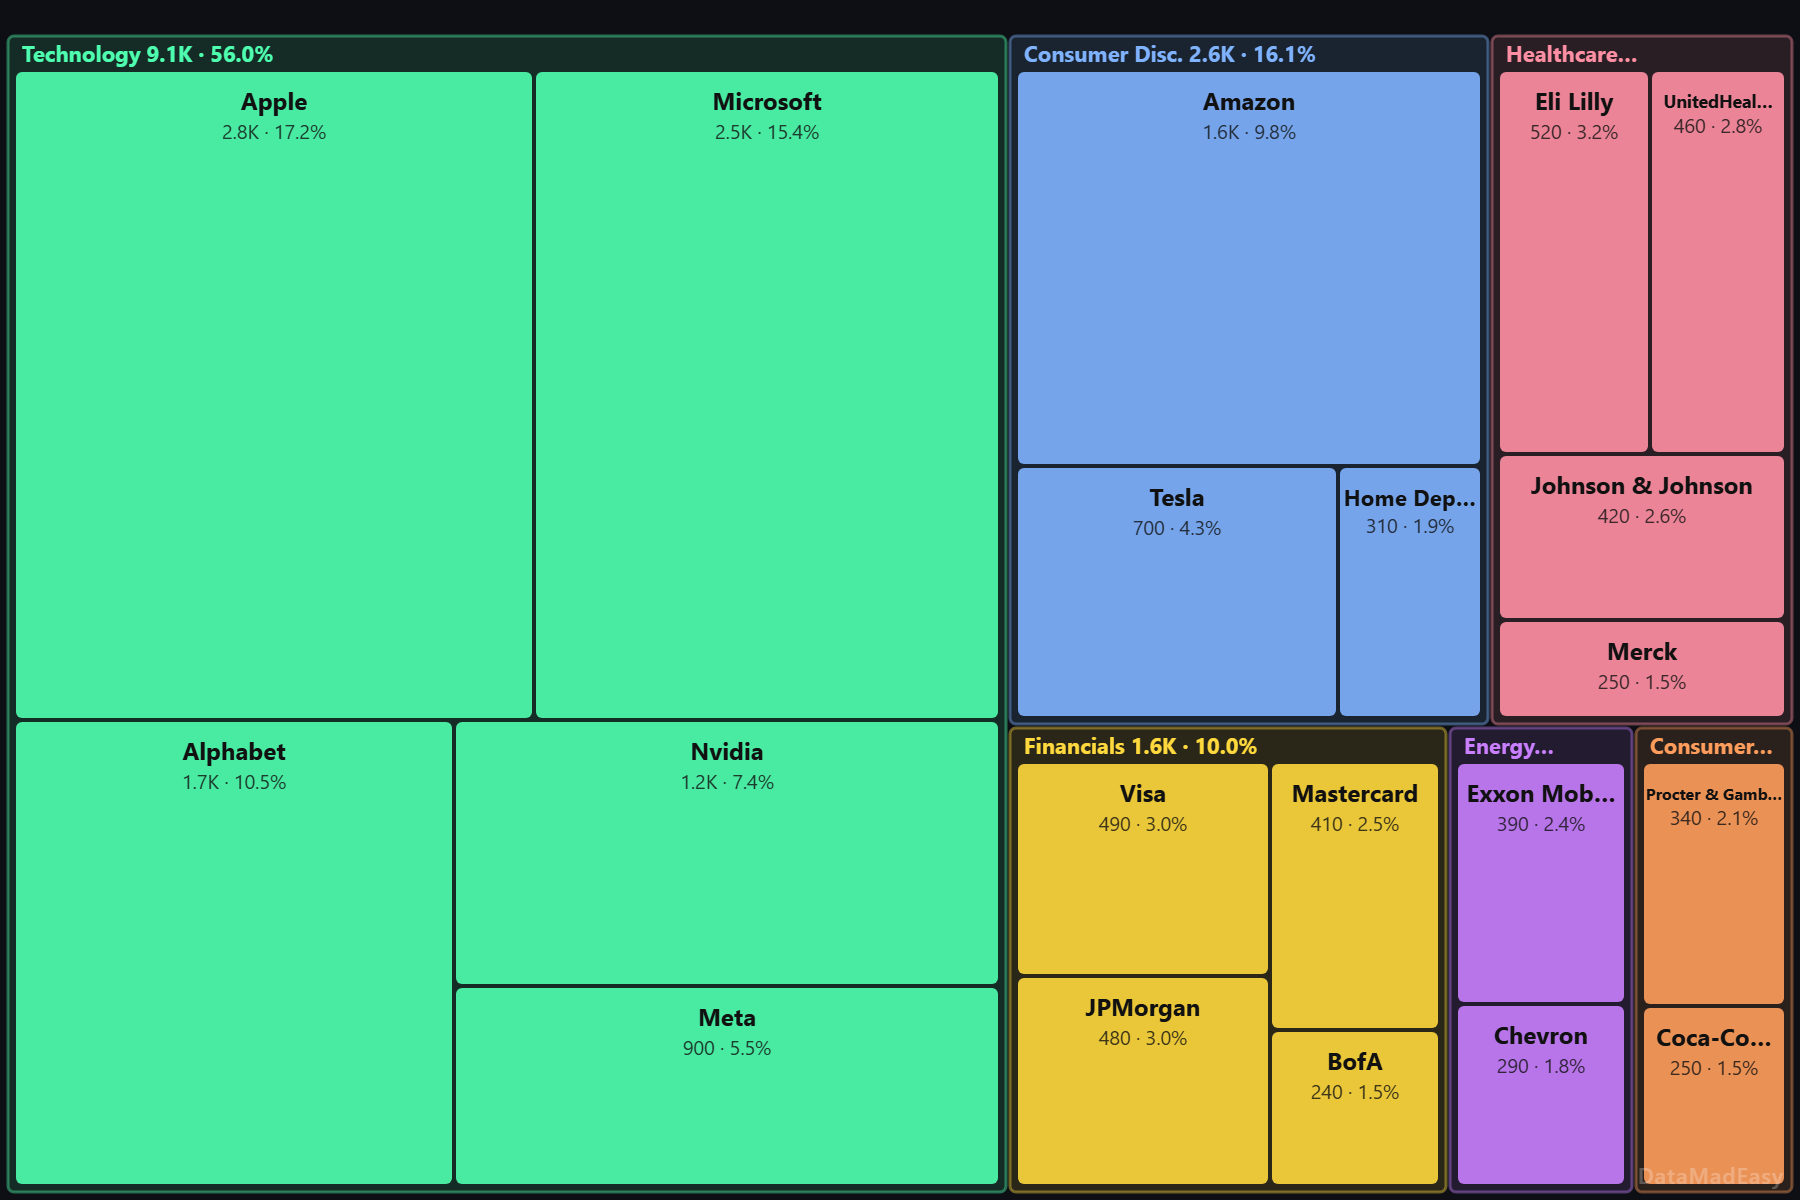
Pie & Part-of-Whole
Scatter & Correlation
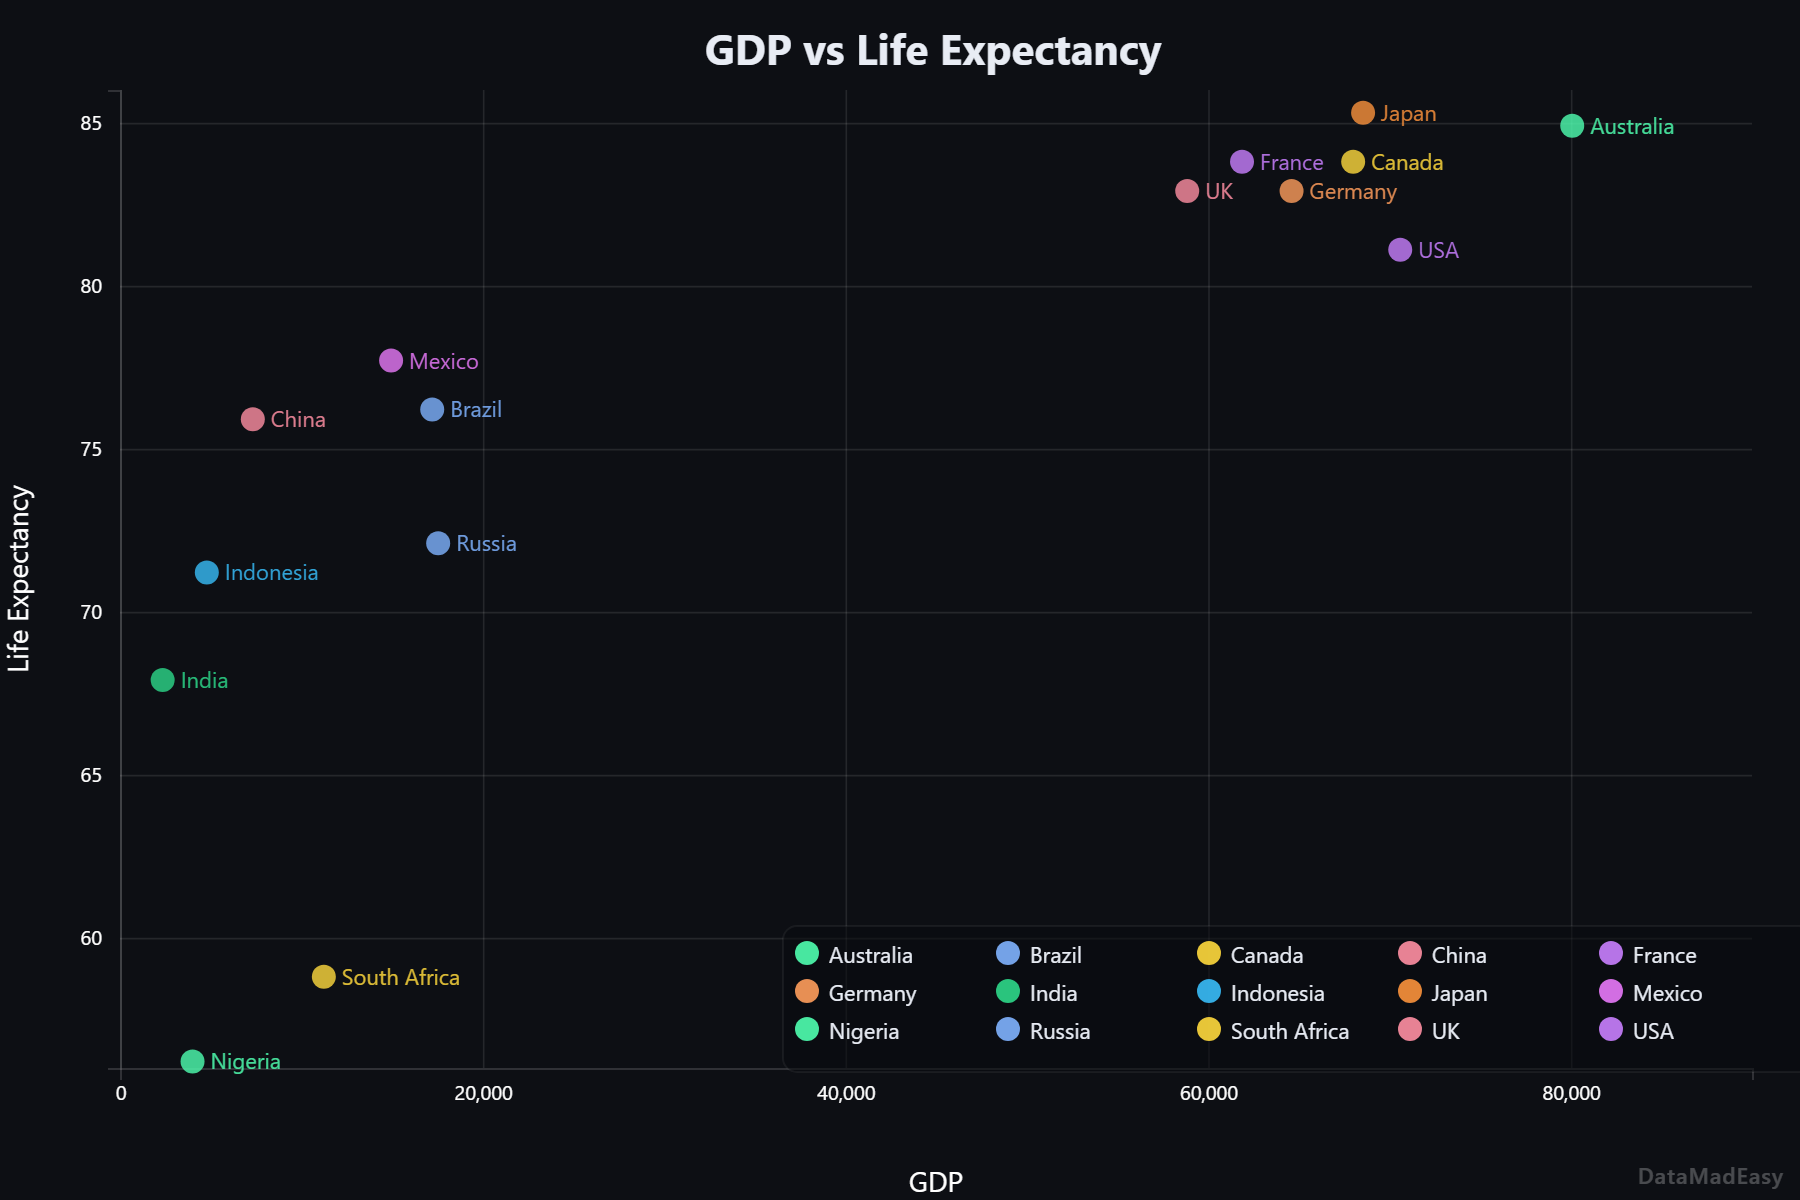
Scatter Plot
Plot two numeric variables against each other. Spot correlations, clusters, and outliers instantly.
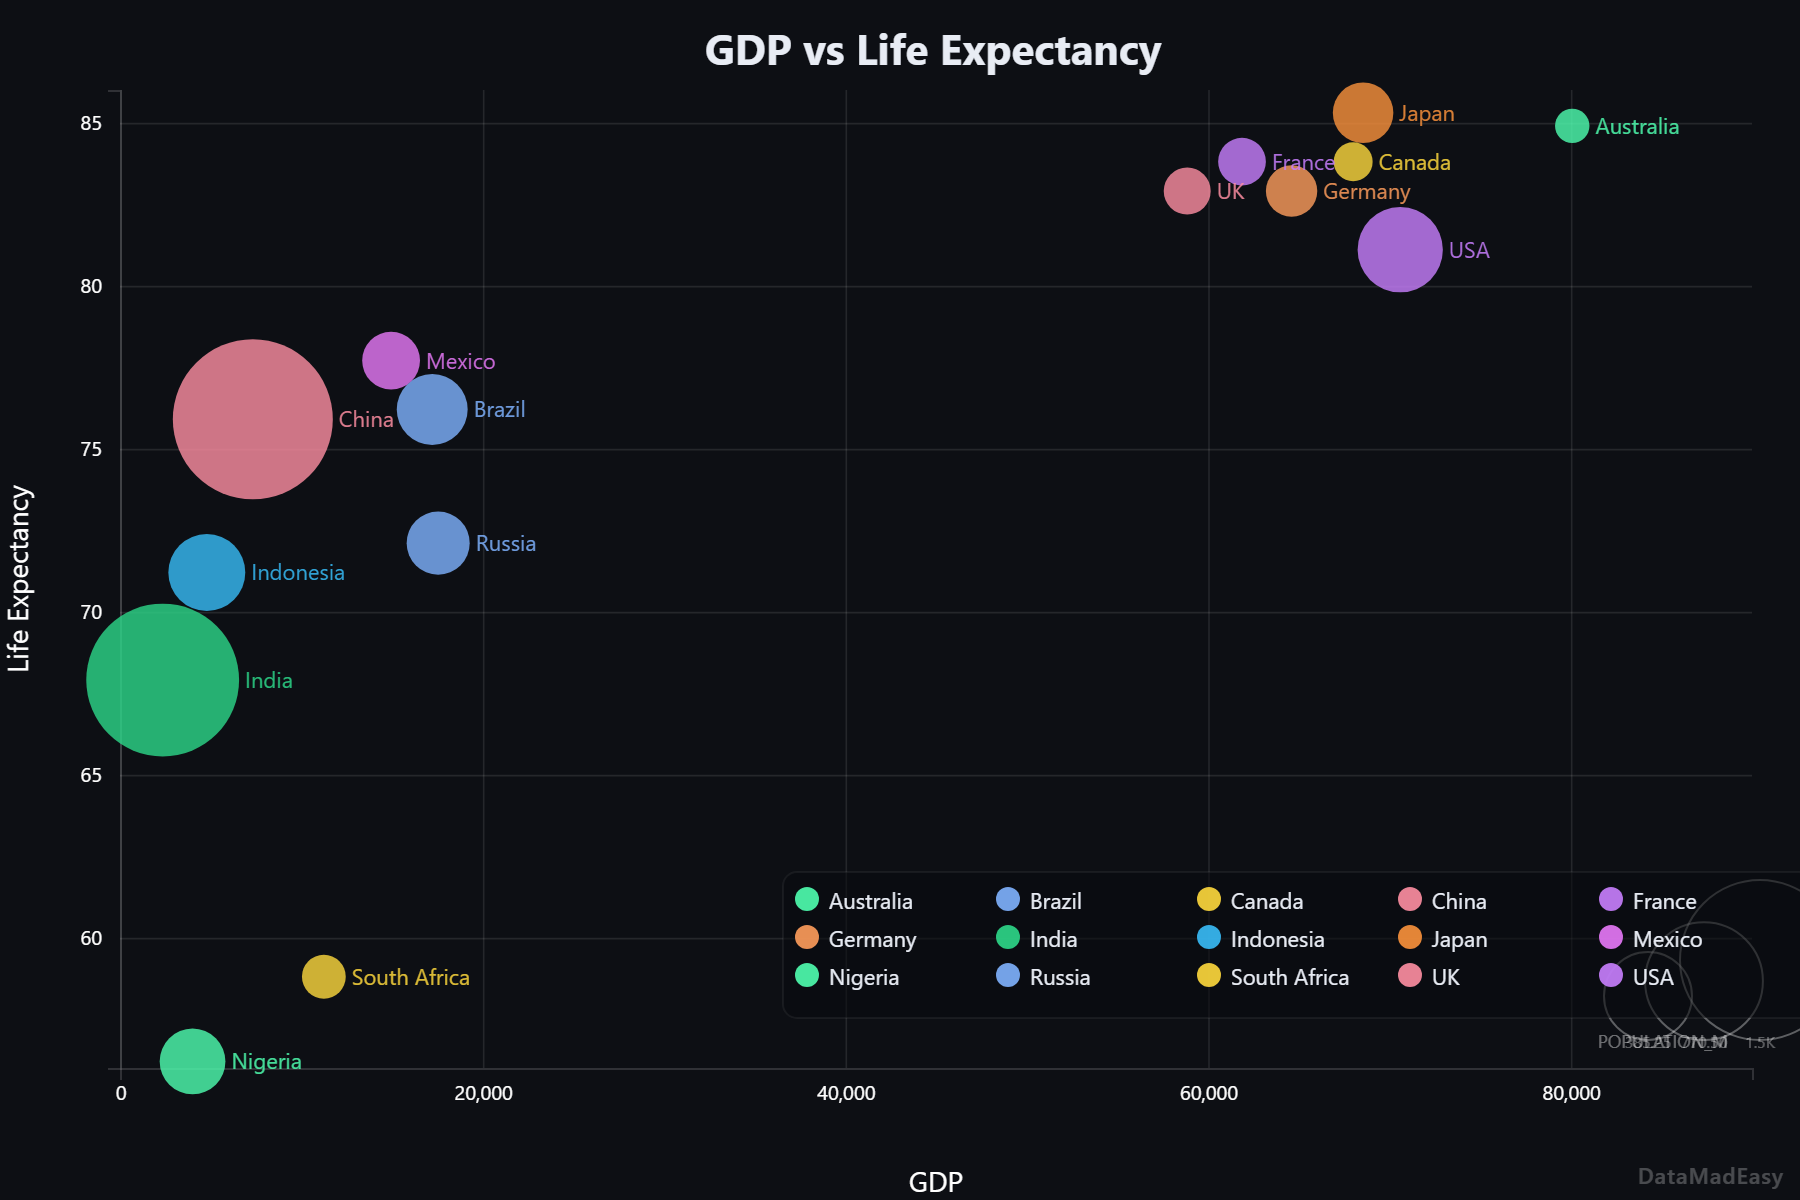
Bubble Chart
Scatter plot with a third variable encoded as bubble size. Compare X, Y, and magnitude together.
Bubble Animated
Hans Rosling-style animated bubble chart. Watch bubbles move across time — X, Y, size, and color axes.
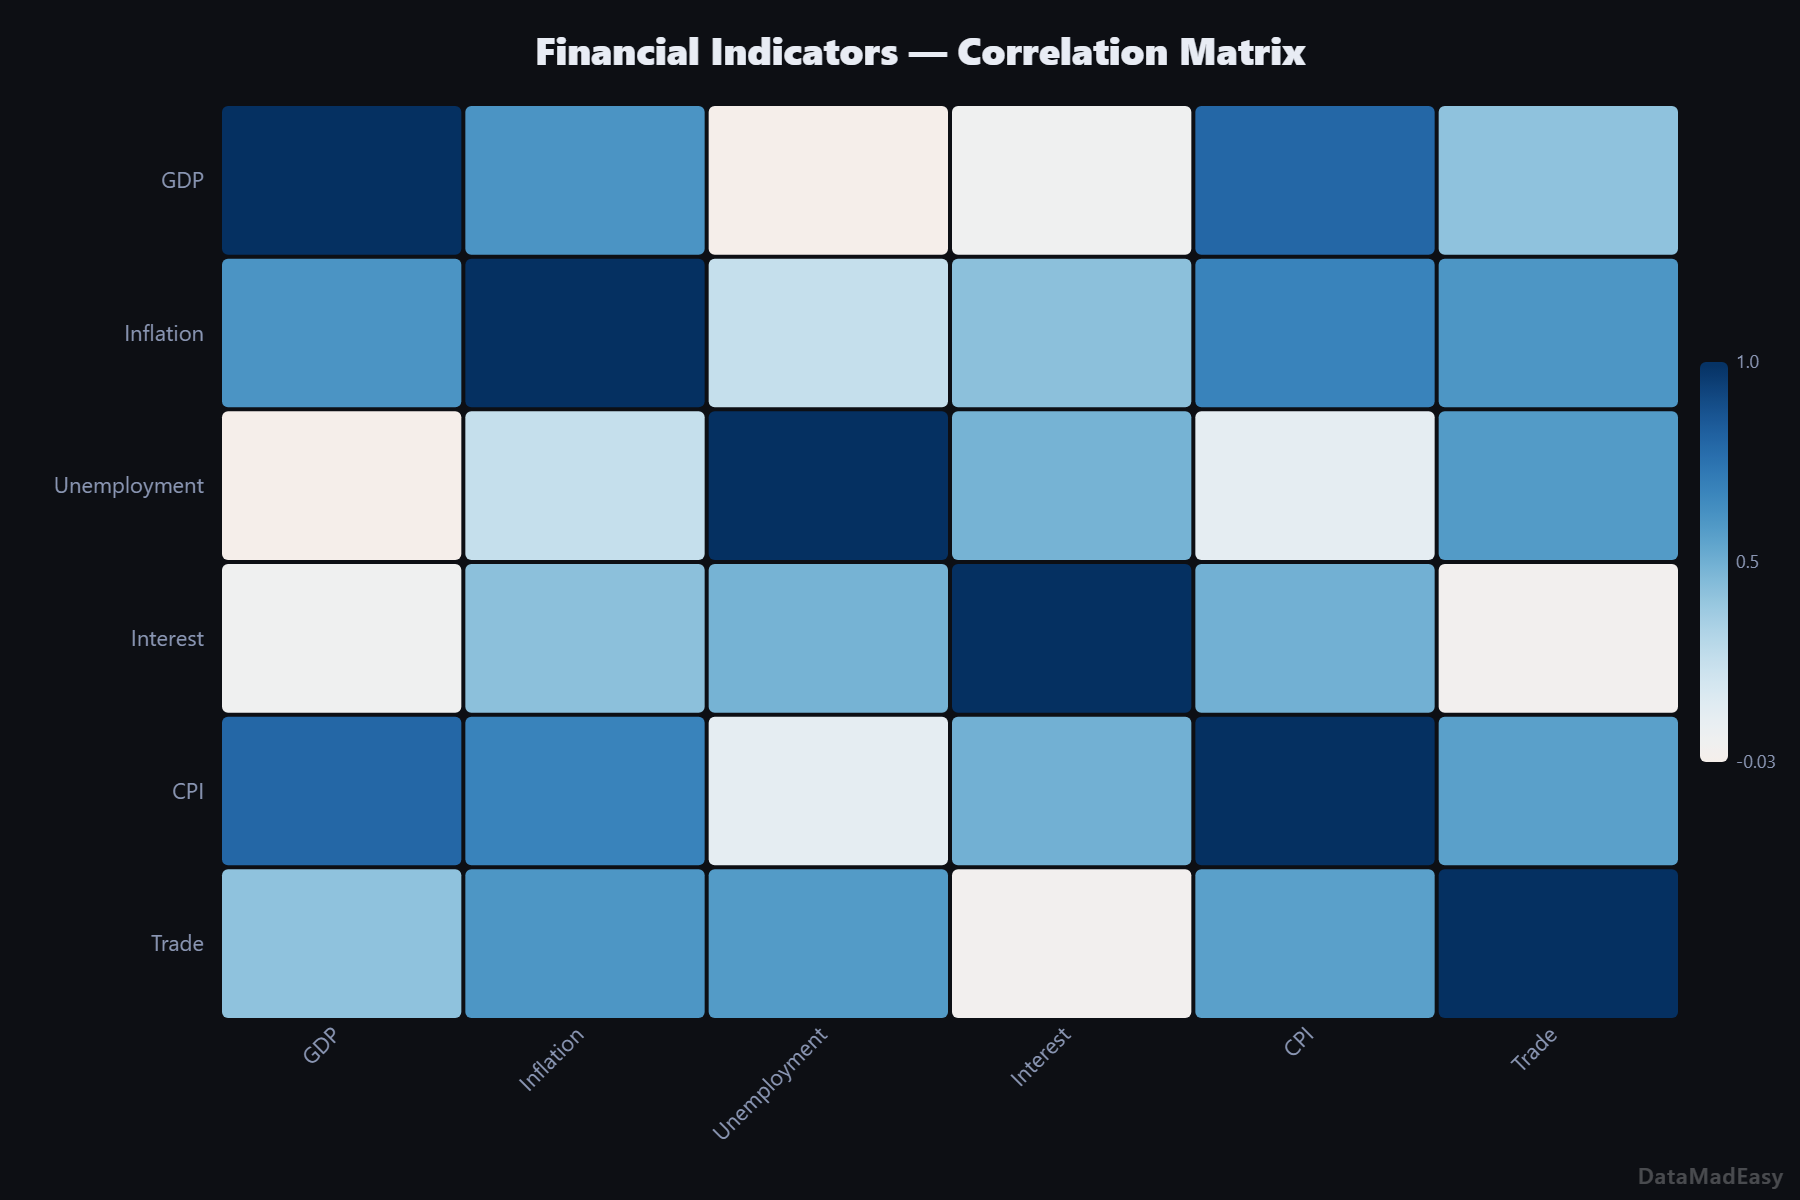
Heatmap
Color-coded matrix for spotting patterns across two dimensions. Correlation matrices, calendars, schedules.
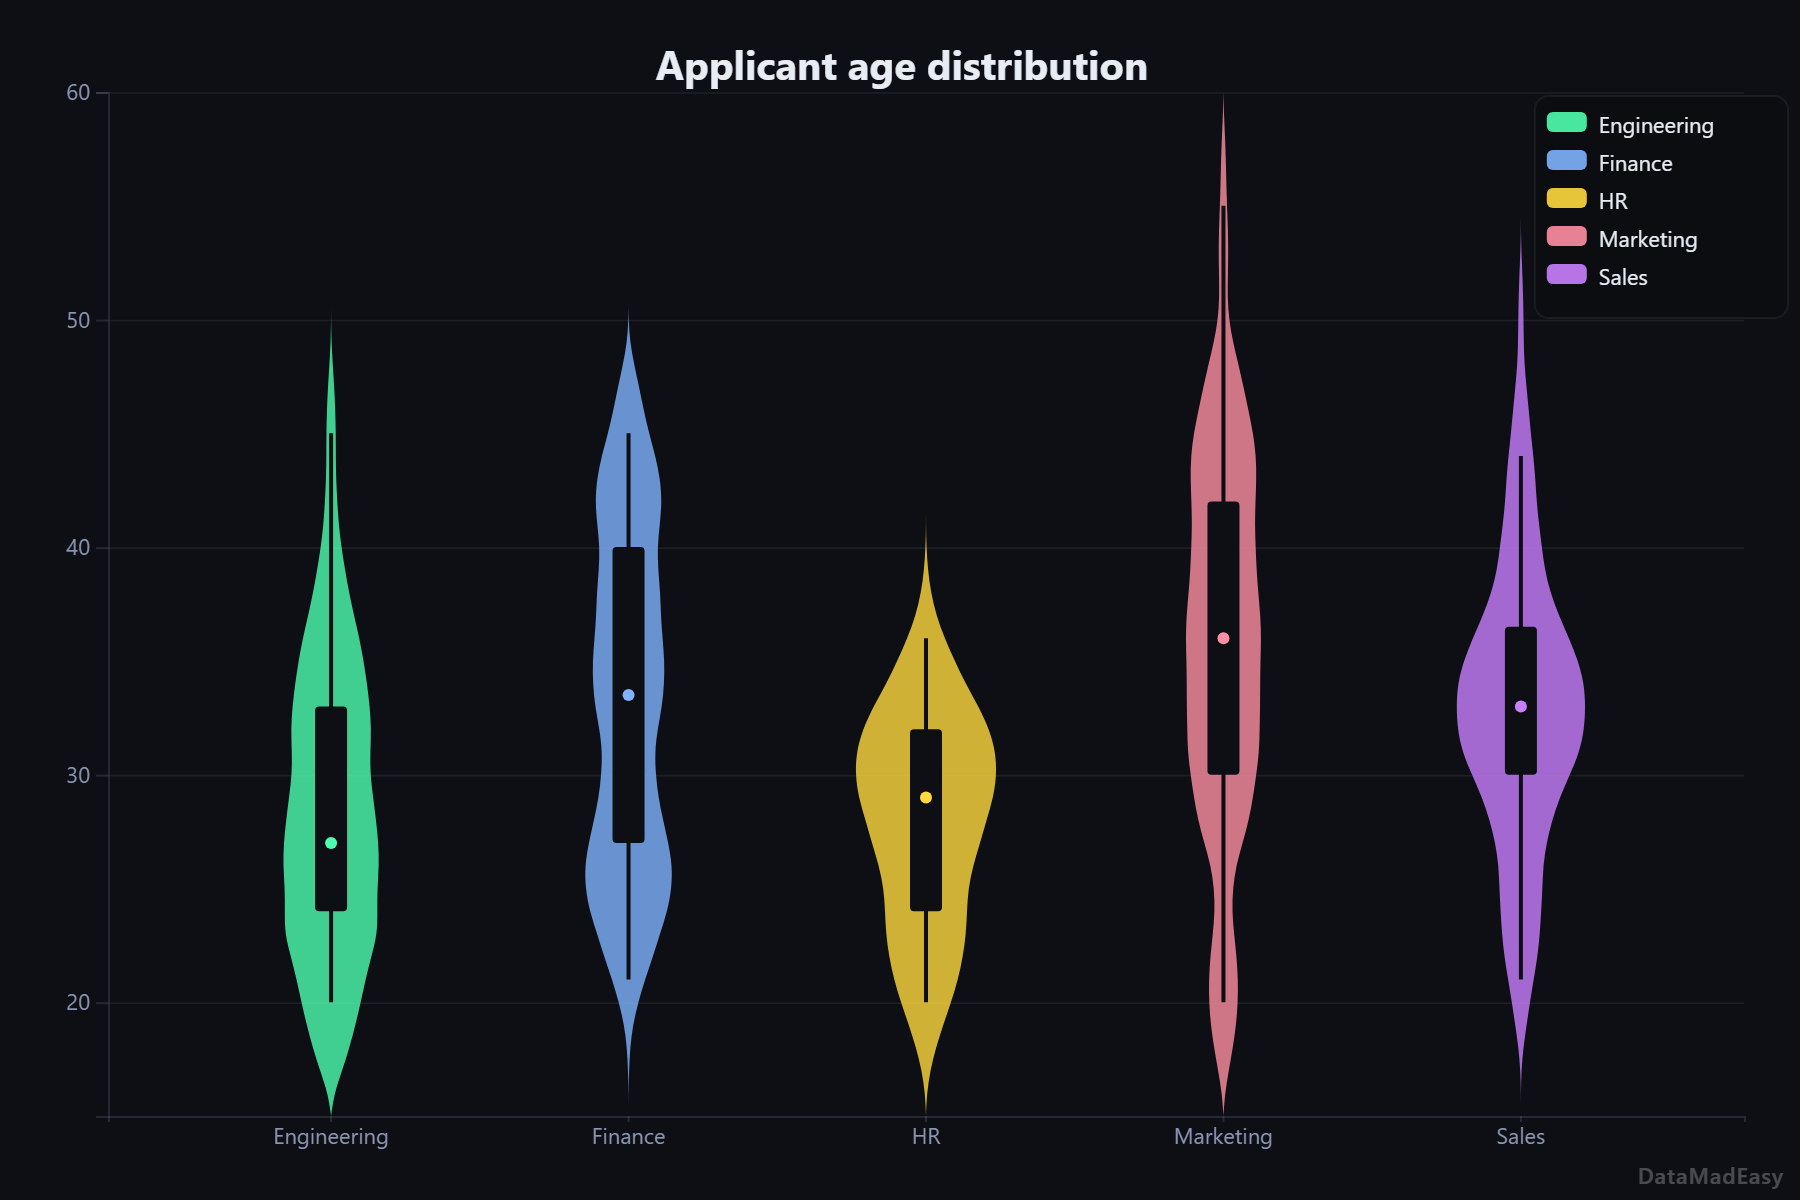
Distribution
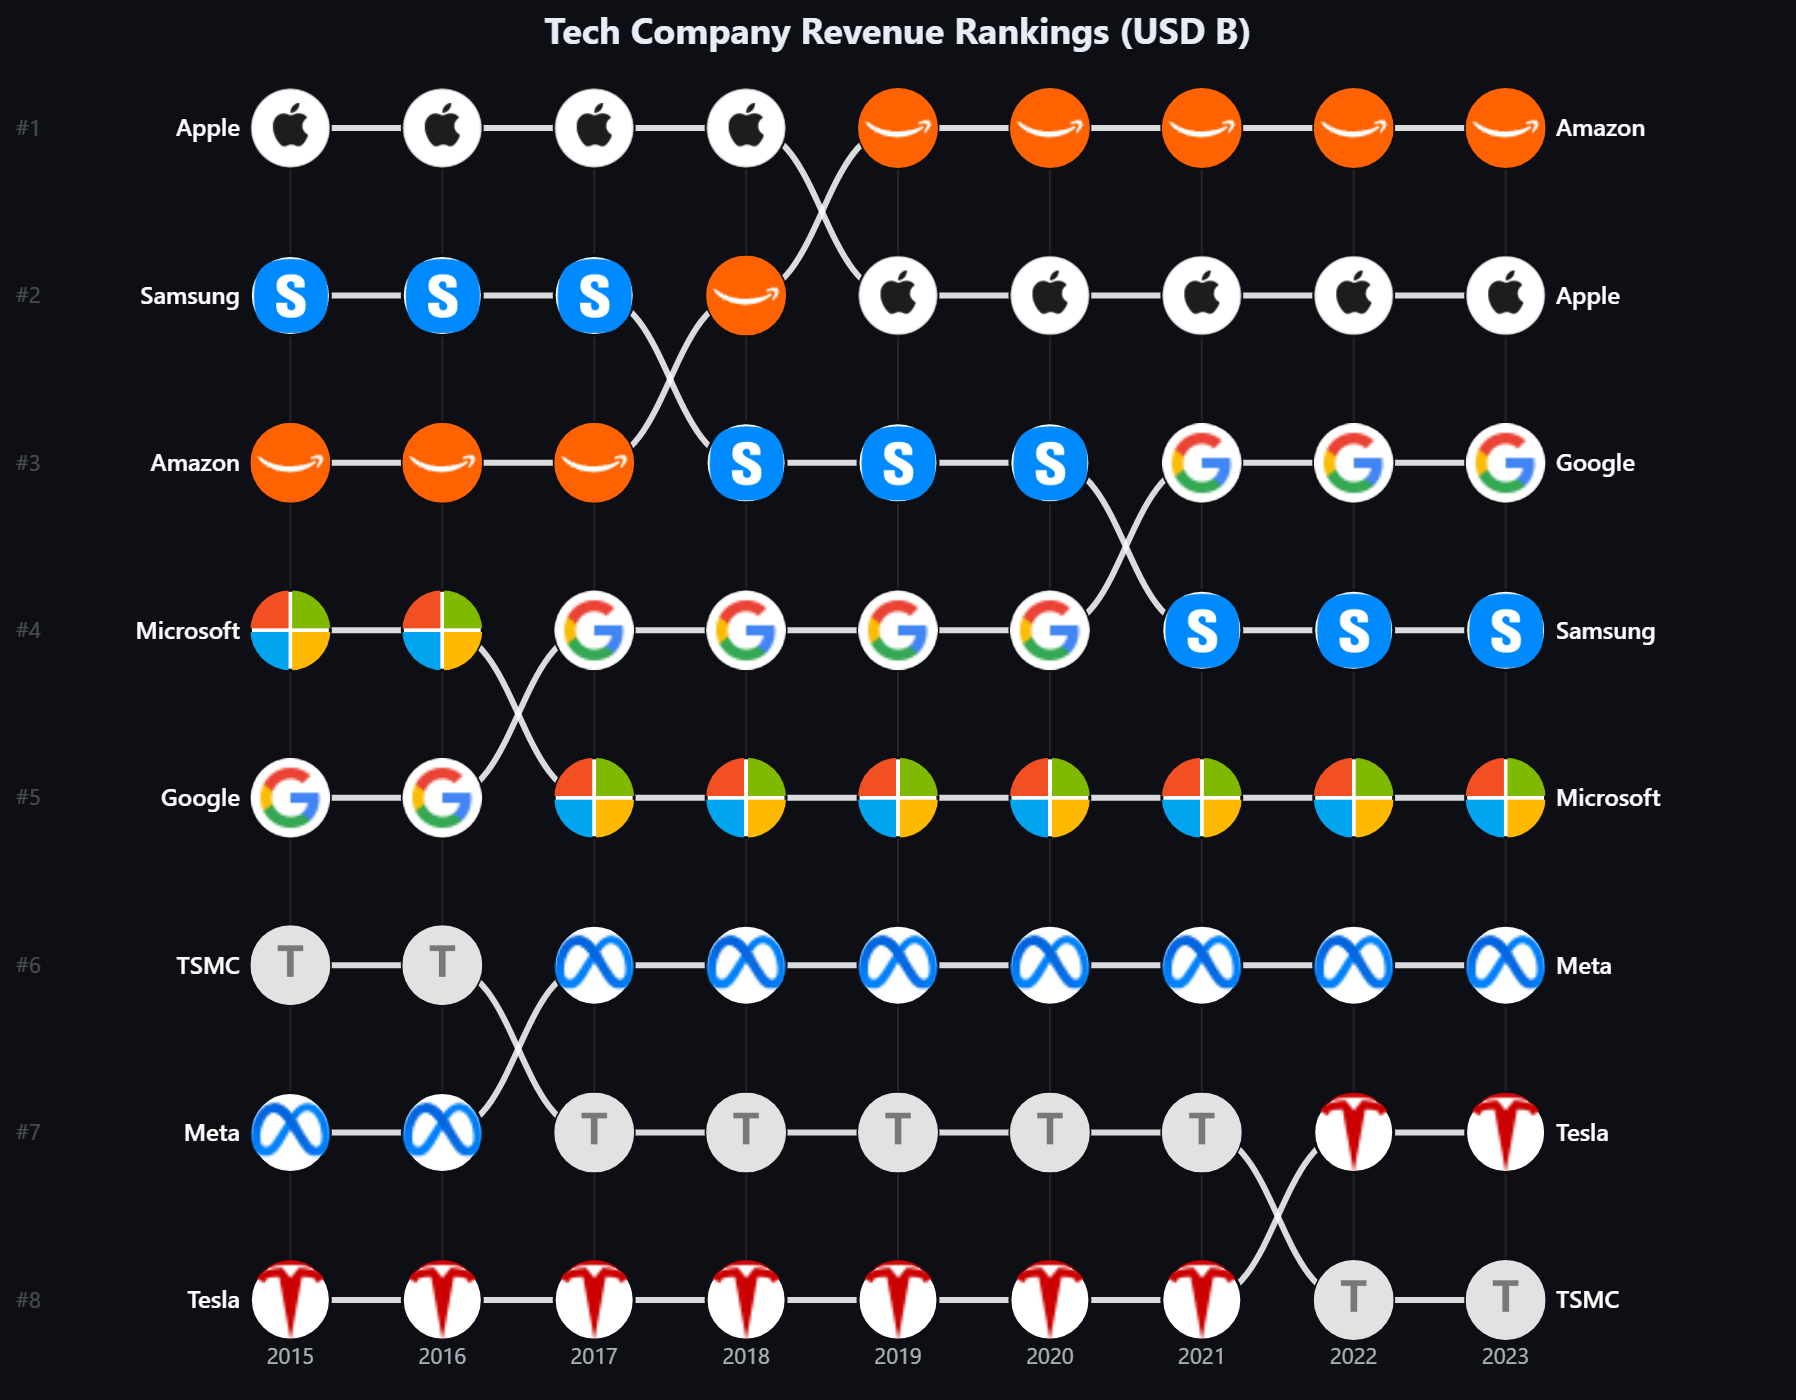
Ranking
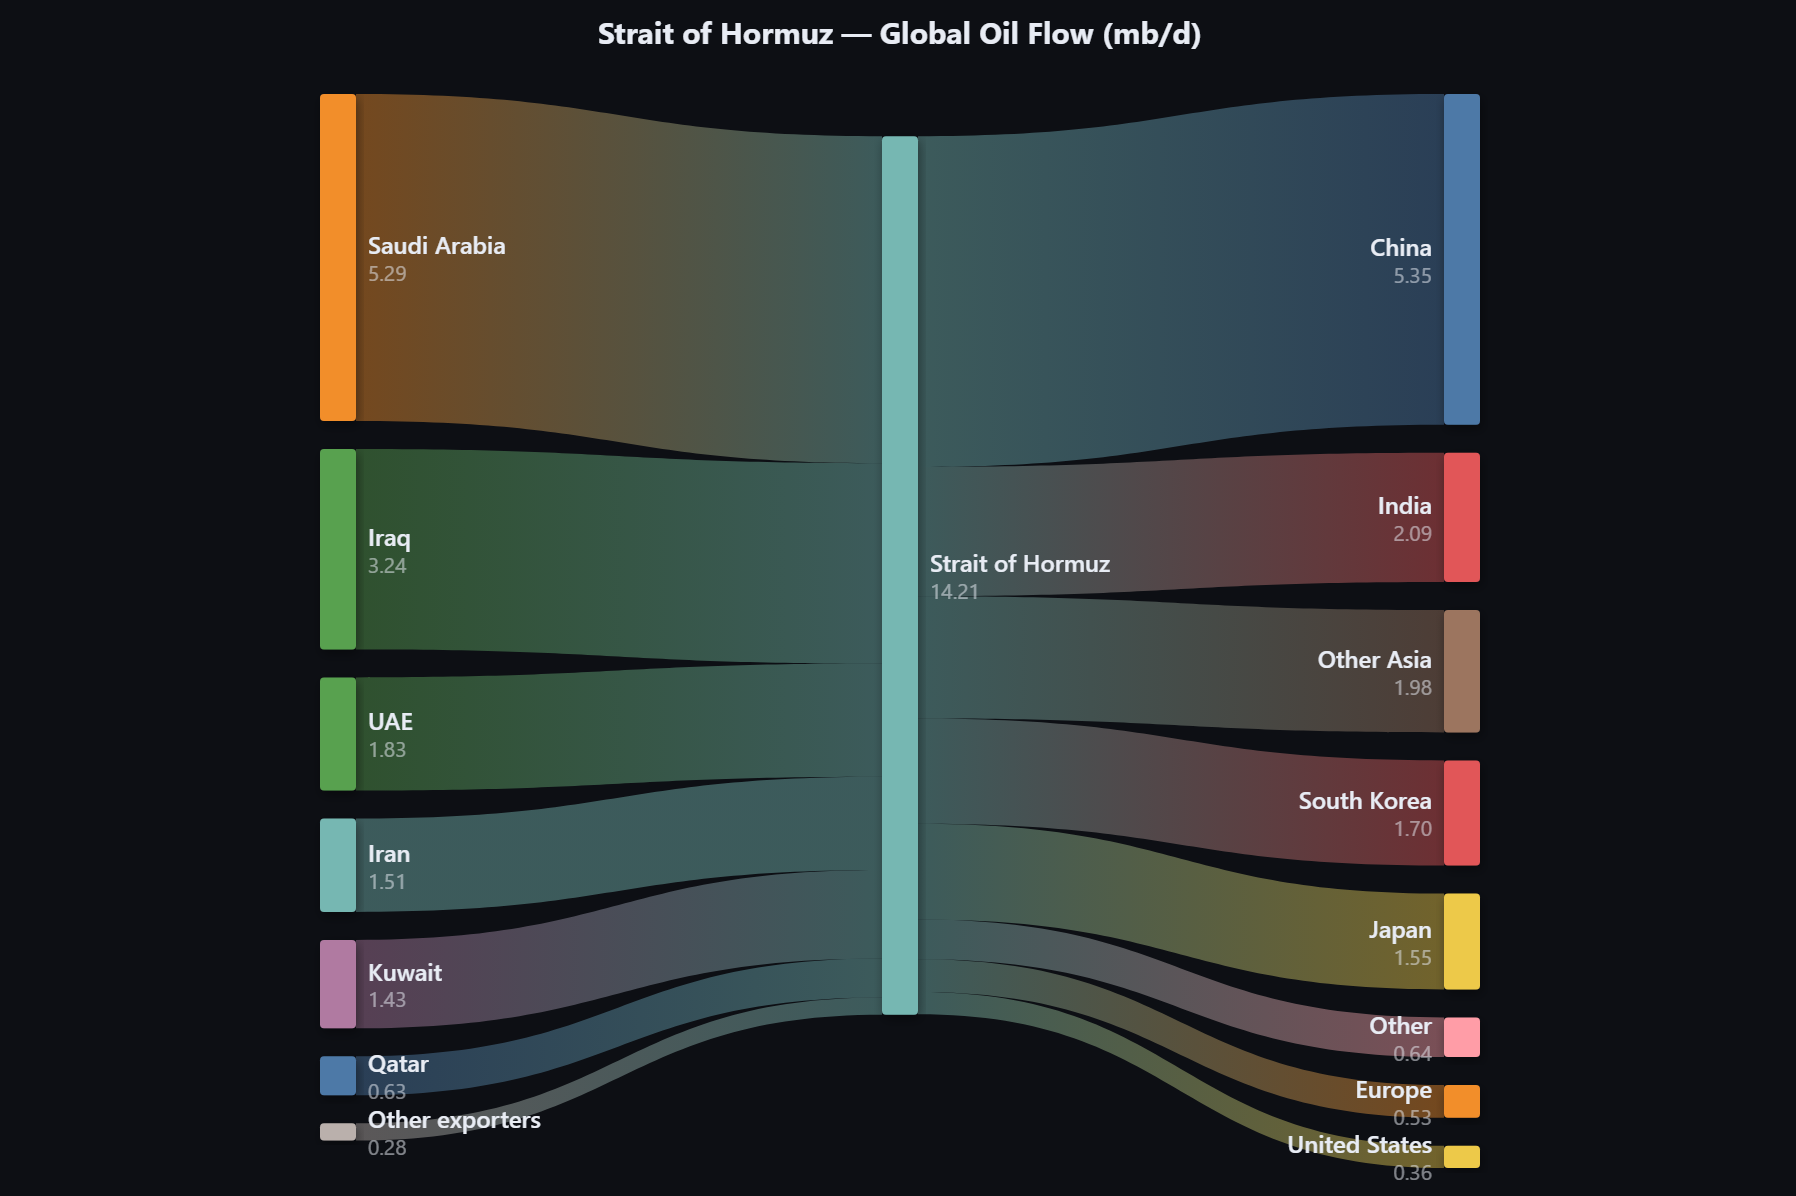
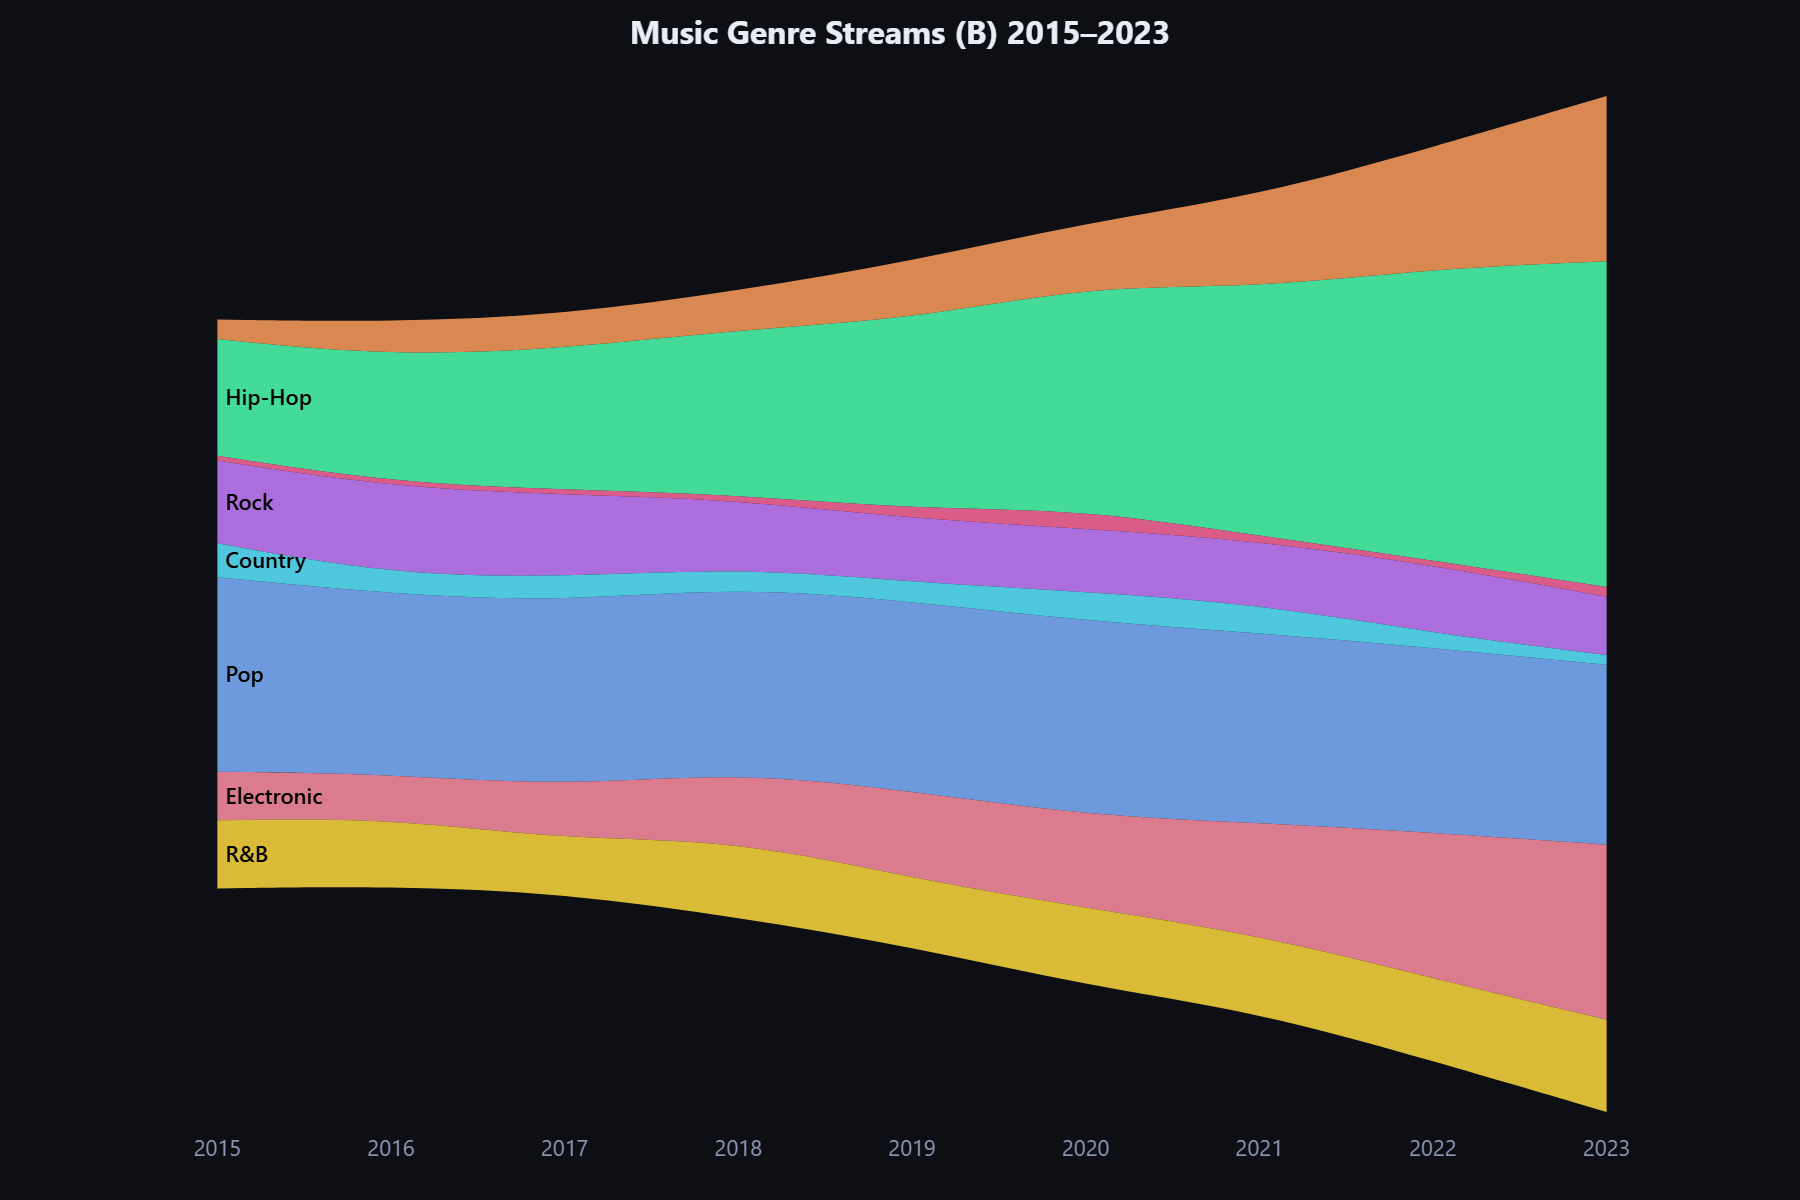
Flow & Relationship
Maps
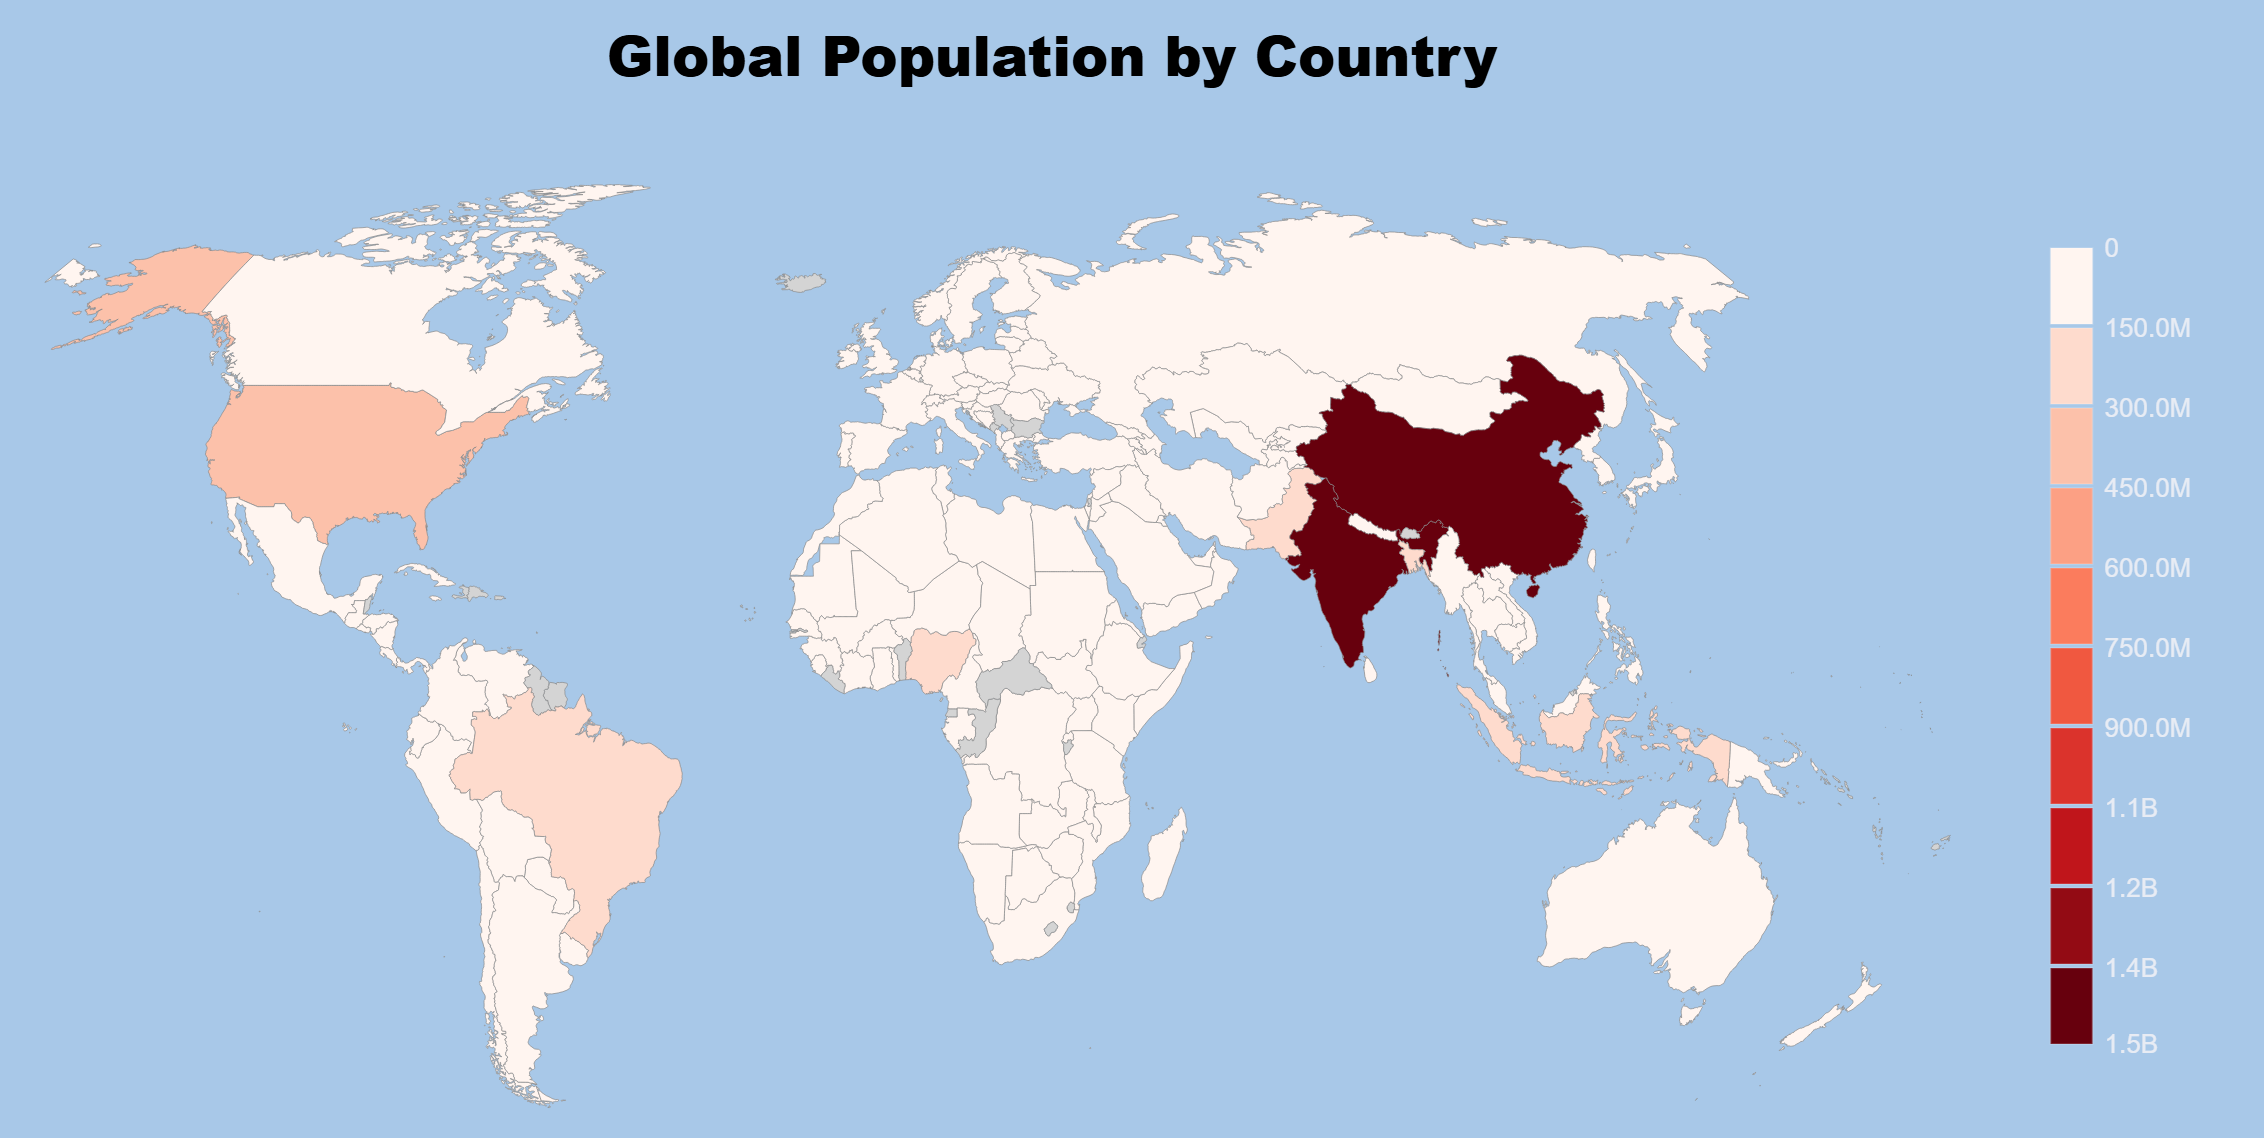
Choropleth — World
Color-code every country on a world map. Spot global patterns in GDP, population, trade, and more.
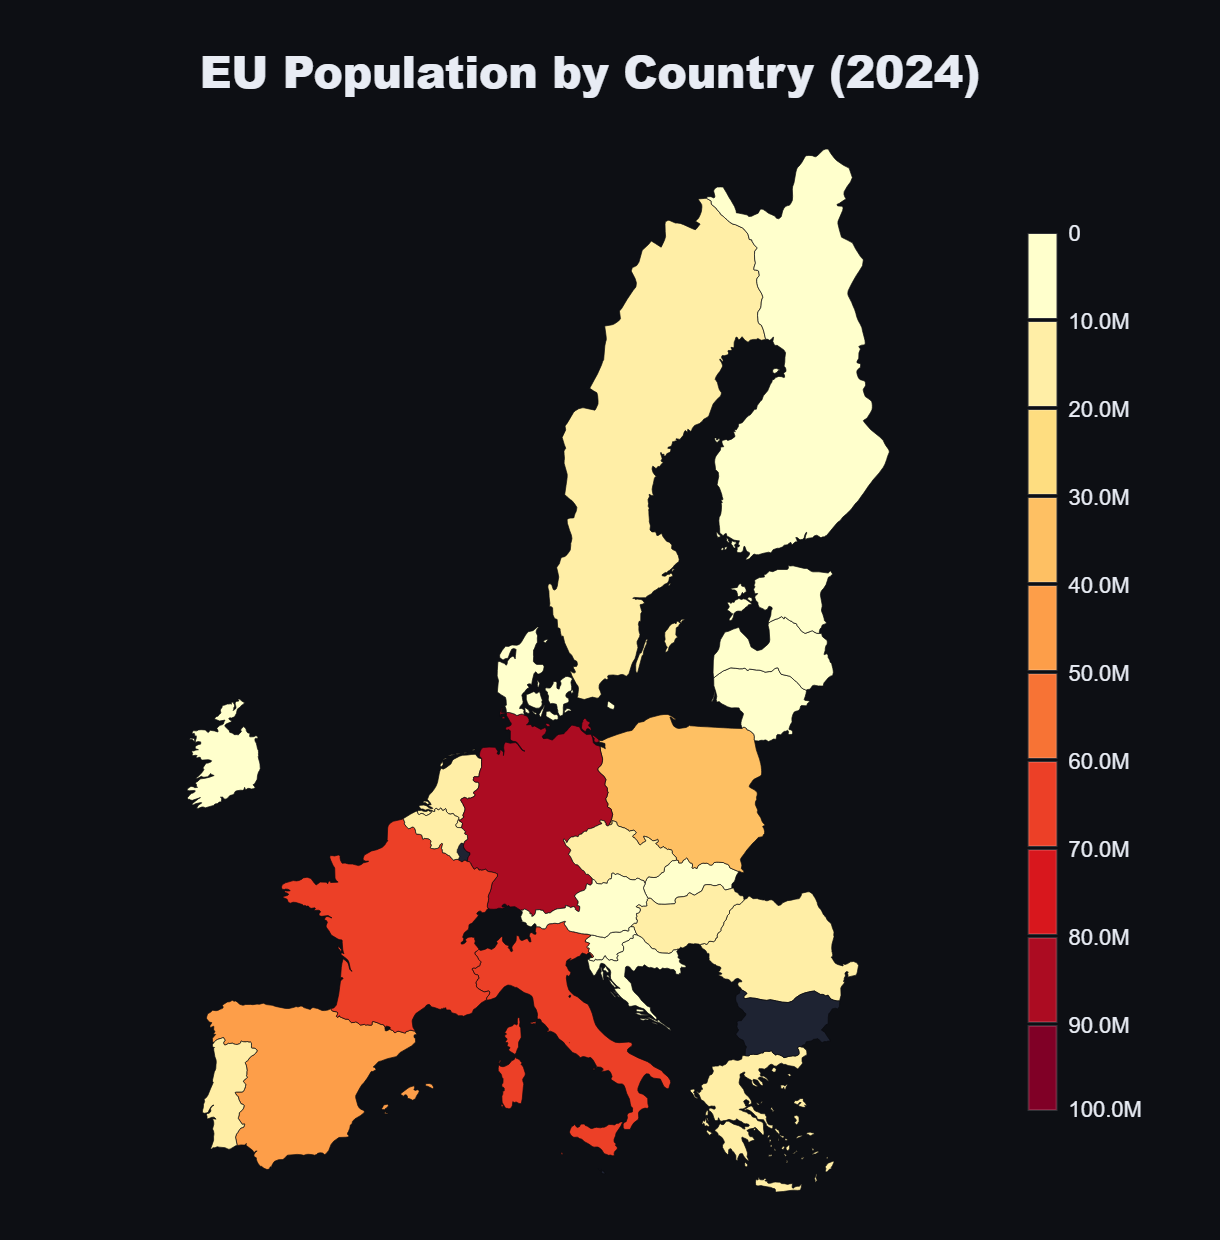
Choropleth — Continent
Zoom into a single continent. Compare countries within Europe, Asia, Africa, and more at a regional level.
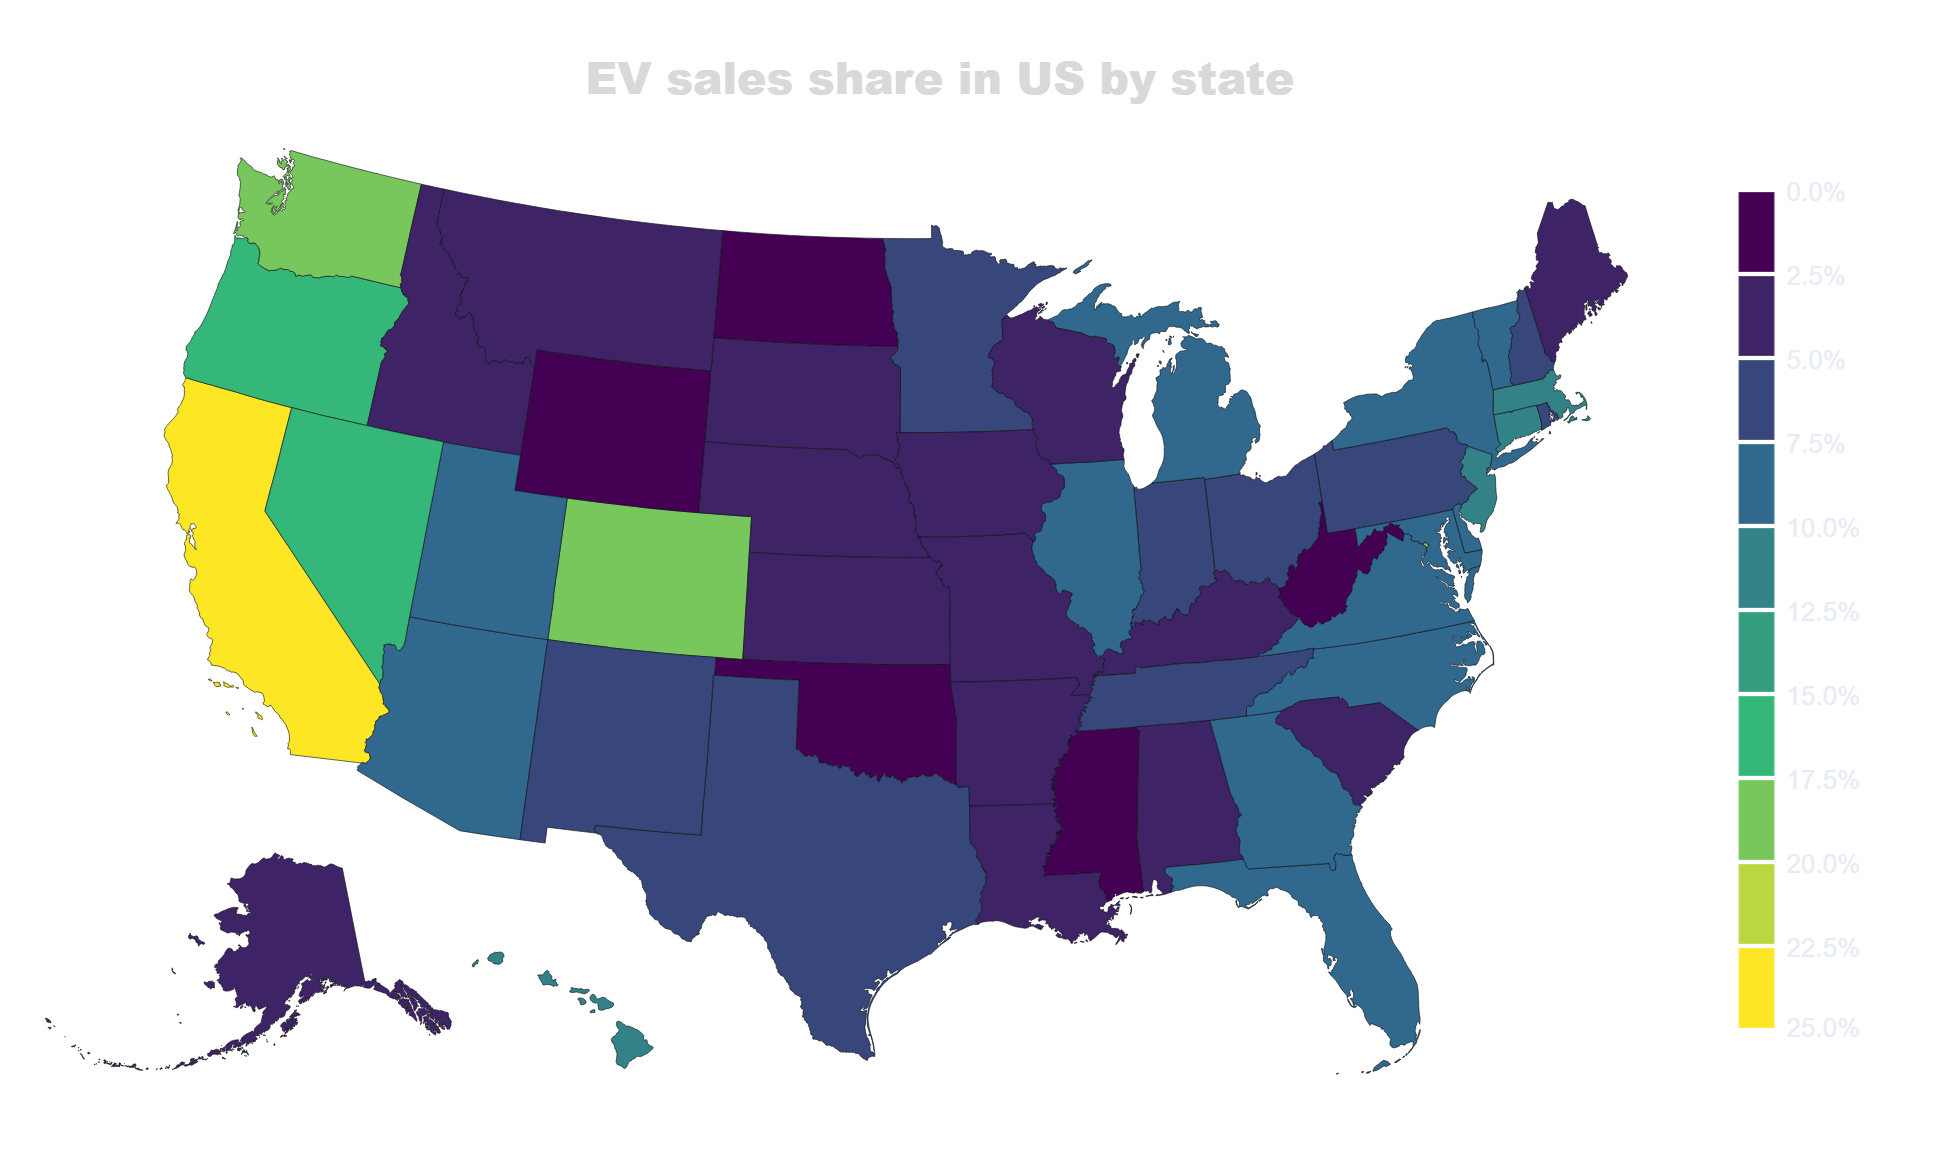
Choropleth — Country/District
Drill into a single country's regions, provinces, or districts. Supports county-level detail for select countries.
Choropleth — State
US state-level and county-level maps. Perfect for regional sales, election results, or demographic data.
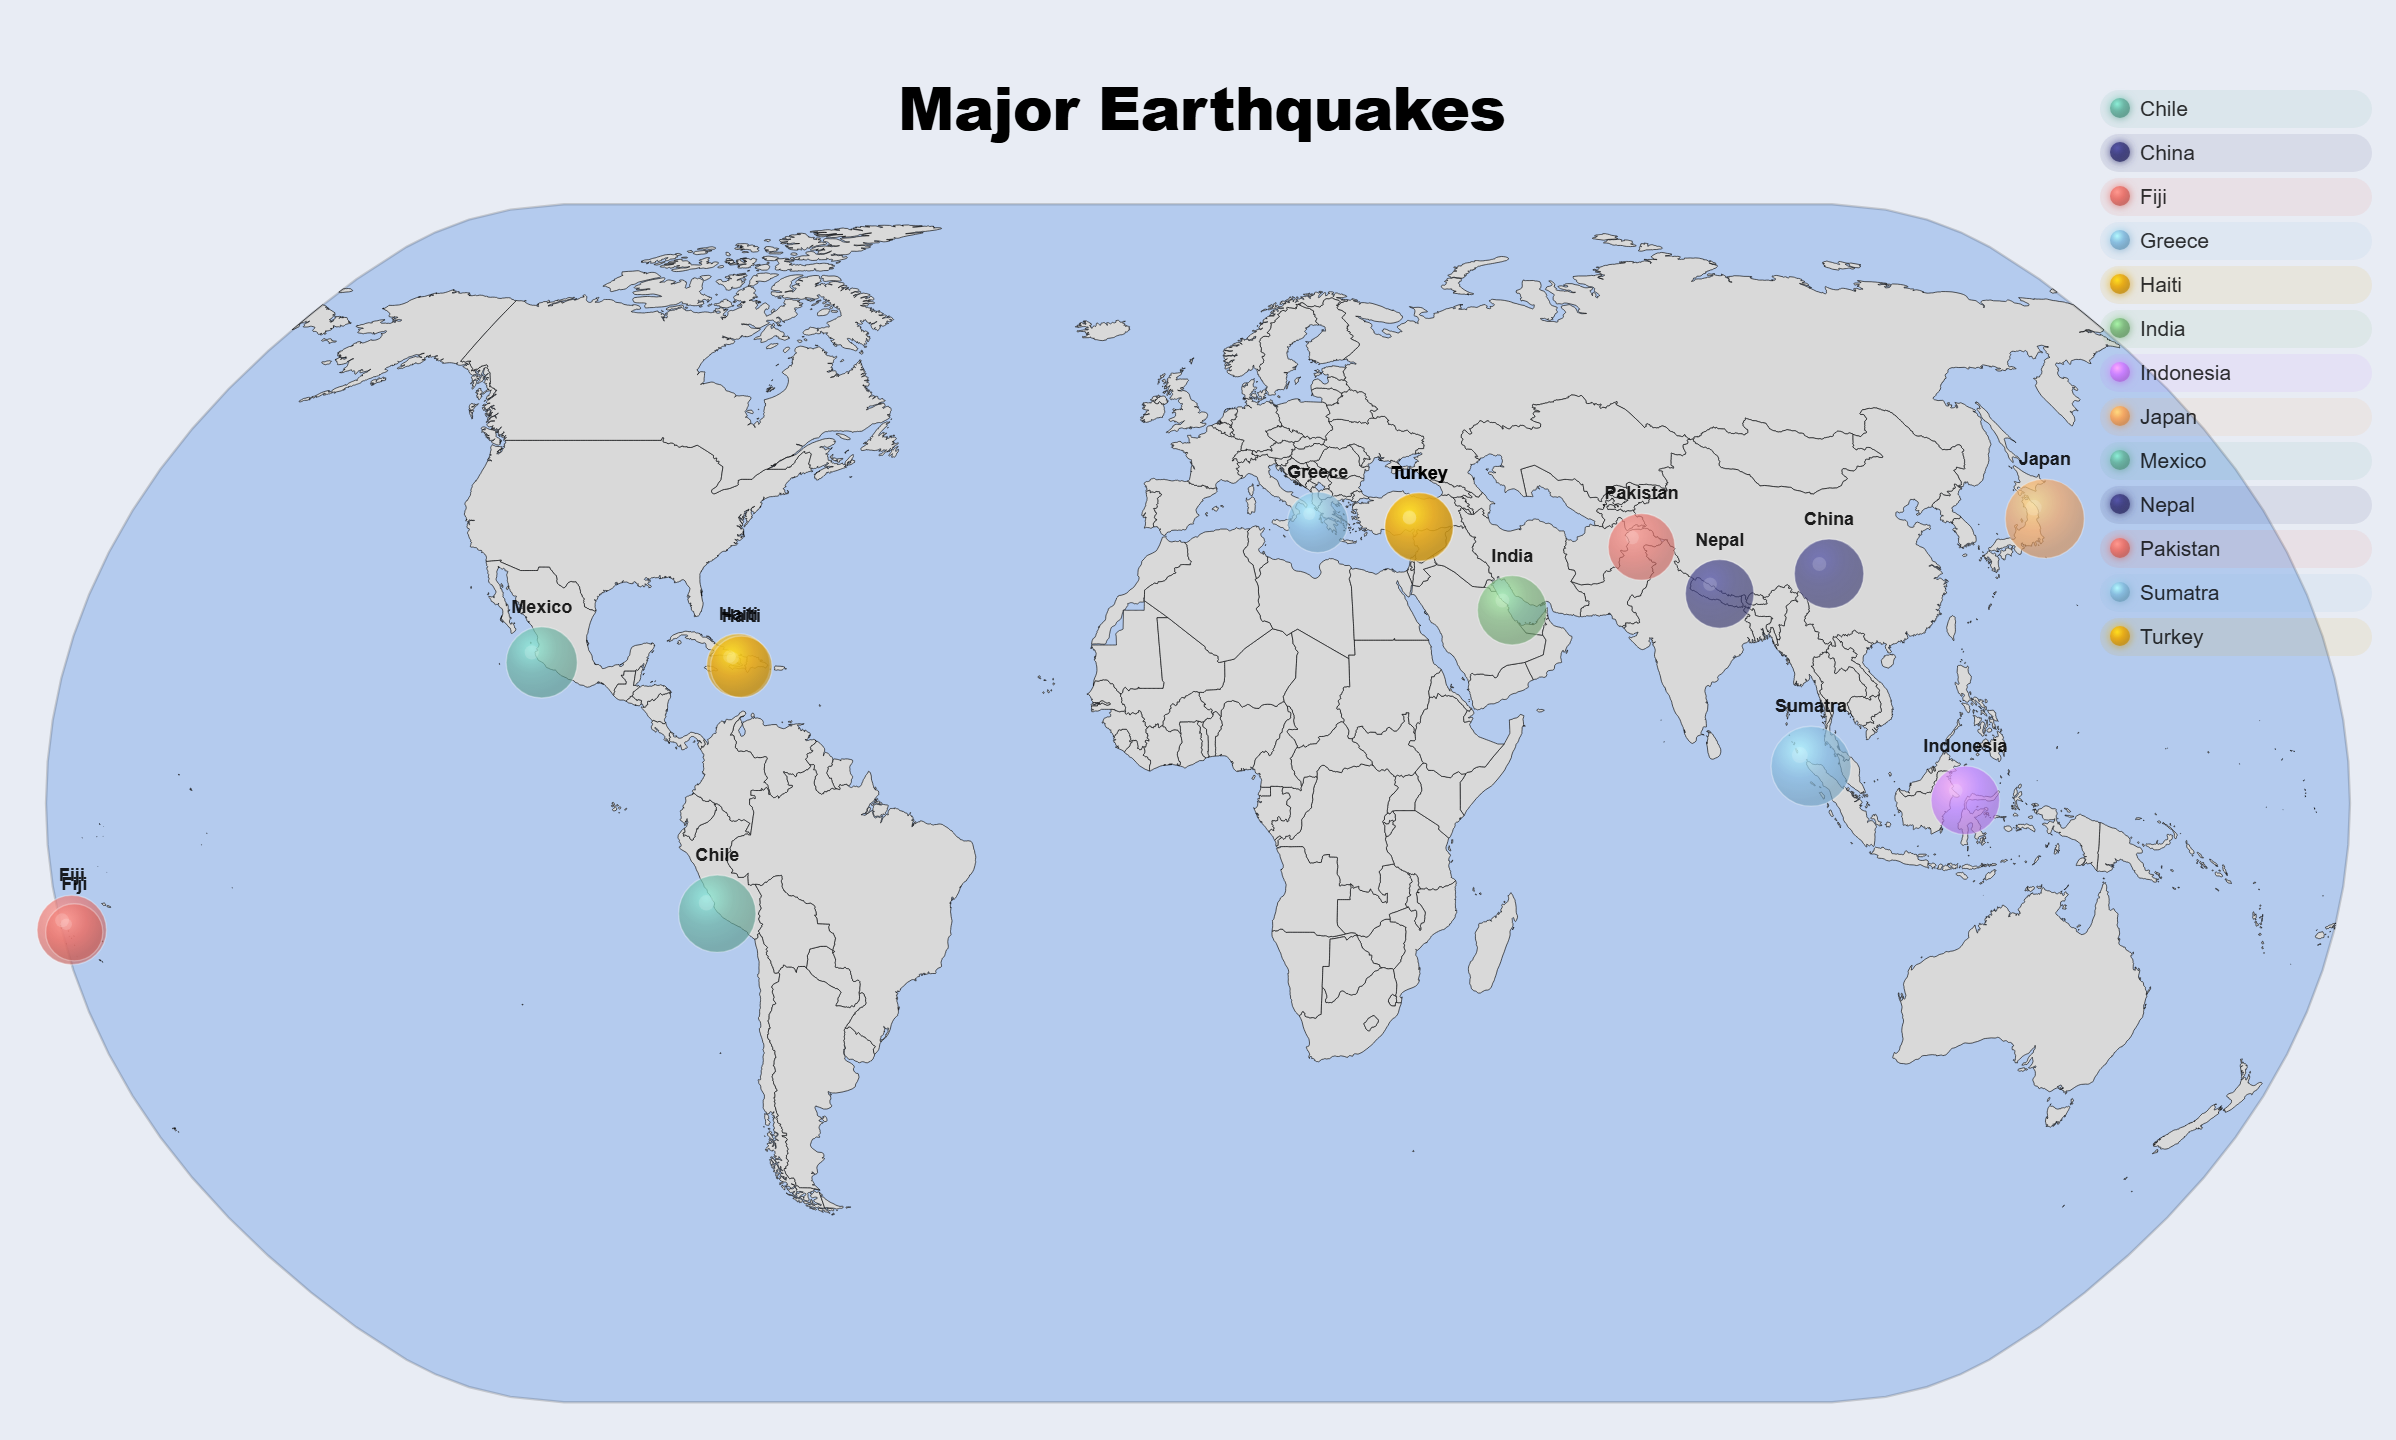
Bubble Map
Plot sized bubbles on a world map. Animate over time — no GIS skills needed.
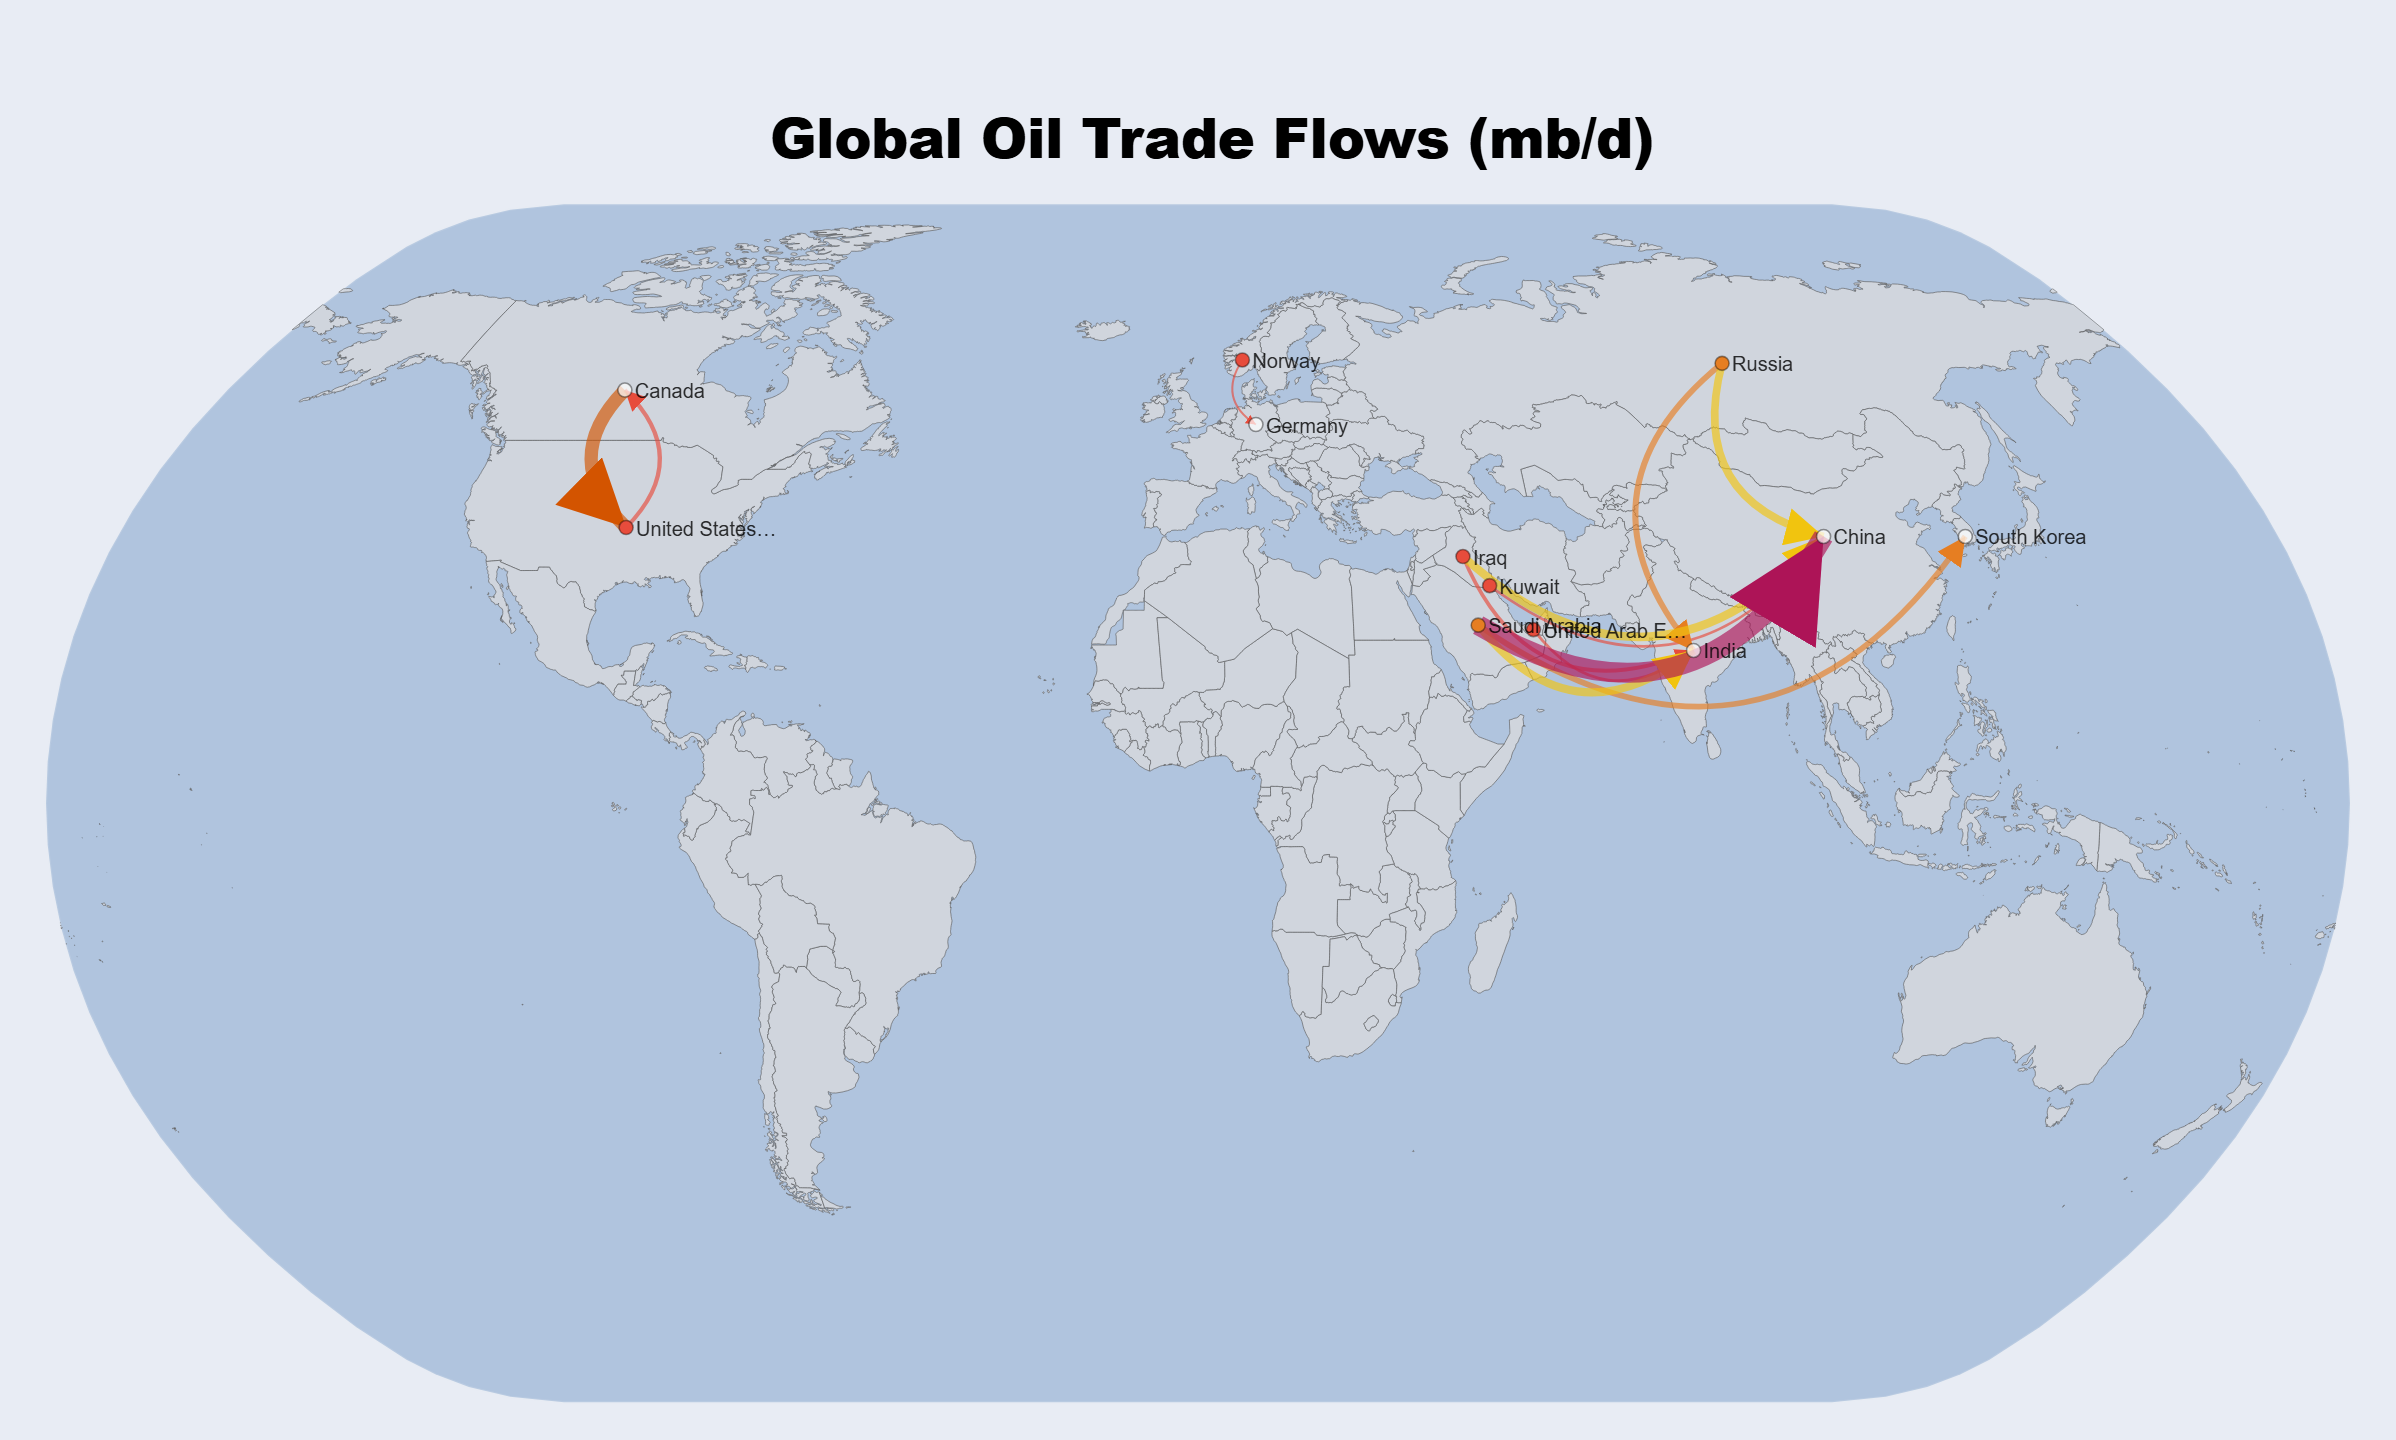
Connection Map
Draw arcs between locations. Flight routes, trade flows, migration — country names or lat/lon.
Data Tools

Pivot Table
Drag columns into Rows, Columns, and Values. SUM, COUNT, AVG, MIN, MAX — with Excel export.

Data Cleaning
Remove duplicates, fix nulls, clean strings, convert types, and detect outliers — no formulas needed.
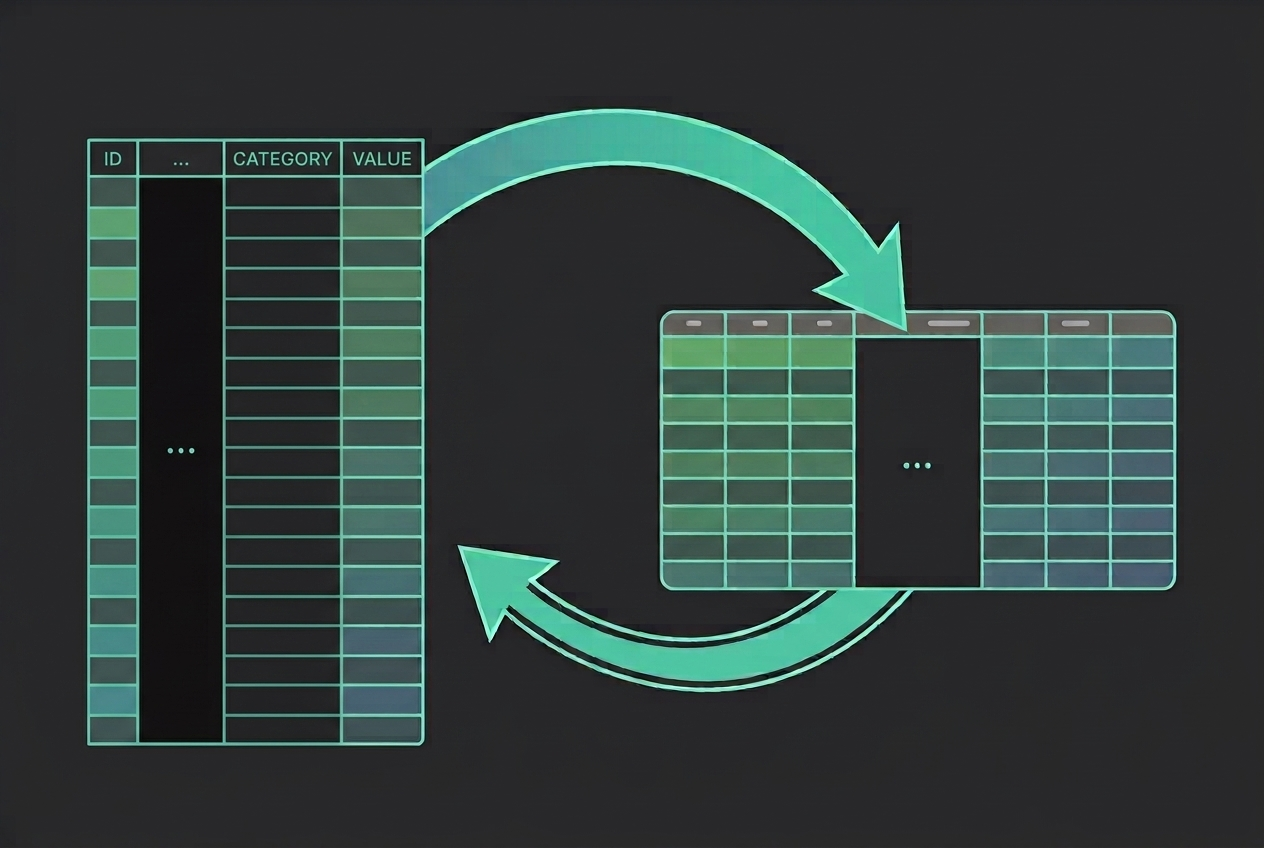
Long ↔ Wide Converter
Instantly reshape between long (tidy) and wide formats. Preview live, download as CSV or Excel.